BBj Metrics Overview
Access to this feature requires an active Software Asset Management (SAM) subscription. See Benefits of ‘Software Asset Management' Feature Line.
BBjServices is a powerful server consisting of numerous services, each providing different server-based functionality including BBx interpreters, administration, SQL engine, servlets, and more. With all this varying user interaction, it may be helpful for administrators and managers to obtain deep insight into the activity occurring inside BBjServices. BBj 18.00 and higher optionally provides a powerful feature exposing a variety of metrics.
For a description of all available metrics, see BBjServices Metrics and BASIS License Service Metrics.
How Metrics Work
BBj uses the open-source Prometheus Client Library (see https://prometheus.io for more information) to instrument (collect) and export the collected metrics for analysis. Use of this format provides the ability to use a combination of the open-source systems monitoring and alerting package, Prometheus, and an open-source visualization tool such as Grafana (see https://grafana.com for more information) to generate beautiful, browser-based, interactive, and highly-customizable visualizations of BBjServices metrics.
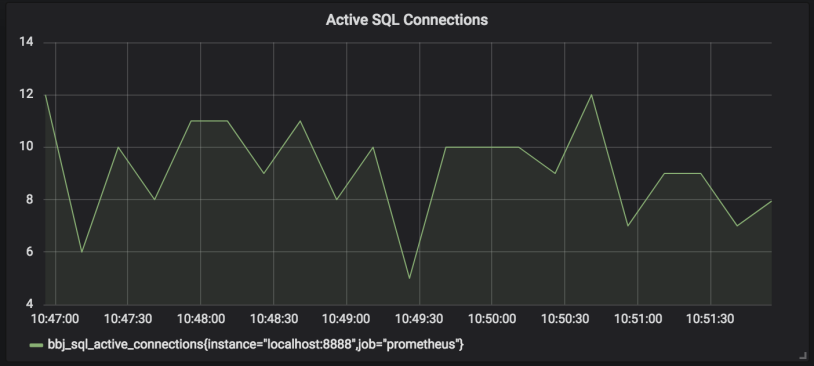
The following image shows an example of Prometheus and a Grafana Dashboard utilizing BBj metrics. The graph displays the number of active SQL connections over a 5 minute period of time. Grafana provides complete customization to change the segment of time to examine, colors, data to include on the graph, and much more.
BBj most often utilizes two types of metrics:
-
Gauges - Values that increase and decrease over time (see the image above).
-
Counters - Values that increase over time.
Note:
All metrics are cleared out when BBjServices is restarted.
Prometheus and BBj
While BBjServices provides a mechanism for generating the metrics, it does not persist this information. In order to use the metrics for analysis, some mechanism needs to be in place for persisting the information. Prometheus is an open-source systems monitoring and alerting package (installed separately from BBj) that is a special type of time-series database designed specifically for this purpose.
Prometheus jobs are created to hit an HTTP/HTTPS URL at a configured interval. It parses the information and stores it in its database with timestamp information so it knows when those metrics were acquired. From the Prometheus documentation, Prometheus's main features are:
-
A multi-dimensional data model with time series data identified by metric name and key/value pairs
-
A flexible query language to leverage this dimensionality
-
No reliance on distributed storage; single server nodes are autonomous
-
Time series collection happens via a pull model over HTTP
-
Pushing time series is supported via an intermediary gateway
-
Targets are discovered via service discovery or static configuration
-
Multiple modes of graphing and dashboarding support.
In short, BBj generates the metrics while Prometheus stores that data making it available for processing and analysis.
Typical Setup
-
BBjServices is installed, running BBj programs, serving SQL queries, etc. all the while gathering various metrics.
-
Prometheus is installed and running on another machine and configured to hit the metrics endpoint on the BBj Jetty server every 15 seconds to acquire updated metrics.
-
Prometheus stores these metrics with updated timestamp information.
-
Grafana (referenced earlier) is configured with numerous dashboards displaying graphs for analysis that are populated by the data stored in the Prometheus database.
Enabling/Disabling Metrics
By default, all metrics are disabled. Upon installation of a version of BBjServices that supports metrics (18.00+), metrics are easily enabled using the Enterprise Manager “Metrics” configuration page opened via the EM navigator at MyServer > BBjServices > Metrics:
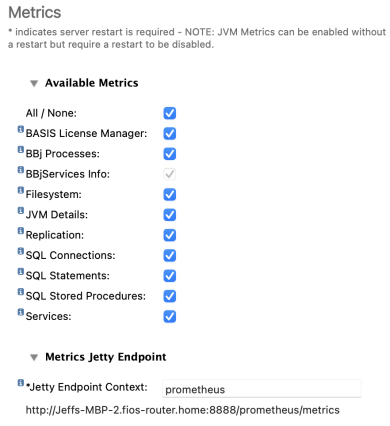
The list of available metrics corresponds to those available on the server. A check indicates that the metric will be collected and exported via the “Metrics Jetty Endpoint” defined below the list of metrics. Make sure to save any changes made to the enabled states of the metrics.
While the metric names are reasonably self-explanatory, hovering over the small “i” icon to the left of the metric name displays a more detailed description of each metric.
Jetty Endpoint Context
BBj exports the metrics via the built-in Jetty web server and at an endpoint defined in this field. The value specified is the base context for the endpoint. Note in the image above that a context of “prometheus” is used and that the servlet name of “metrics” is appended to that to build the full path. While the context is configurable, the servlet name is not.
NOTE: The context specified here does not correspond to the contexts configured elsewhere in the Enterprise Manager.
Endpoint Security
Most of the metrics provided by BBjServices should be relatively useless with regard to security (number of connections, process counts, etc.). However, some metrics include usernames (never passwords) which could be considered a security risk. To protect this data, BBj 18.10 introduced mandatory security for the metrics endpoint. The security uses “basic” type HTTP authentication where the credentials must be a valid BBj username/password.
By default, only the “admin” user has access to the metrics endpoint. However, to grant permission to an additional user(s), simply add the “View Metrics Results” permission to the user or group profile in the EM at Security > Users or Security > Groups respectively.
Available Metrics
It’s important to keep in mind that with more metrics enabled, more system resources will be used for calculating and storing those metrics. While this is generally minimal, over time it could accumulate and have a performance impact.
Most tools such as Prometheus and Grafana, use content assist to provide the available metrics as well as a description of the metric, as an administrator is building a dashboard or query.
Importing Existing Dashboards
Grafana is the most common visualization tool use with Prometheus. This open-source package provides a powerful, highly-customizable interface for creating dashboards with one or more graphs, tables, and more. Grafana includes an import/export feature making it possible to share dashboards with others using the same metrics. BASIS provides several dashboards to help users get started.
To import a BASIS dashboard:
-
From the Grafana interface: Add > Create > Import
-
In the Grafana.com Dashboard field, enter the dashboard ID. Alternatively, visit the BASIS Grafana dashboard site for all available dashboards.
-
Click in the JSON area which will load the dashboard information.
-
Select your BBj instance from the dropdown (name is dependent on what was provided during configuration of Grafana).
-
Click Import.
Note:
Grafana.com is a useful (and free) resource to share your dashboards with other BBj developers/users.
Custom Metrics
BBj applications have the ability to export custom metrics through the same mechanism used by the built-in metrics. This makes it possible for programs to provide metrics specific to the features and functionality of the application such as user interactions, feature utilization, logins, etc.
BBj uses the open-source Prometheus JVM Client to instrument the metrics and export them via the BBj Jetty server. This means the developer can directly utilize those classes to instrument their own metrics using embedded Java and/or their own custom Java library. For complete details using the API, see the Prometheus JVM Client readme.
However, there is an easier way to use custom metrics from BBj 18.00+ code utilizing the BBjAPI.
BBjAPI
For complete details on the types of metrics and how they work, please consult the Prometheus documentation. However, BBj implements support for two types of metrics using the BBjAPI object: counters and gauges.
Concepts
Counters and gauges should be created one time, by one and only one BBj process. This is due to the fact that all processes should access the same instance of a counter or gauge. To make this easy to accomplish from BBj programs, the BBjAPI provides registerMetricXXX(), getMetricXXX(), and unregisterMetricXXX() method for each type of metric.
Once a metric is registered (see examples below), the metric, its description, and its values (including labels) will automatically appear at the Jetty endpoint (see EM configuration information above) defined to export the BBj metrics, no additional configuration necessary.
Naming Metrics
Metrics are mapped according to a unique name, typically following the convention of all lower-case characters with underscore separating multiple words in the name, e.g. "my_custom_metric." Note that BASIS uses the “bbj_” prefix when naming internal metrics, so avoid using that prefix to minimize confusion.
Registering and Acquiring Metrics
An application should provide some mechanism for acquiring the current instance of the metric. While programs can directly ask the BBjAPI for a particular metric by name, it may be easier from a code maintenance standpoint to move this logic into a class or function call. However, that would be something for the developer to decide based on their current programming style and best practices. See the examples below for information on registering and acquiring the instance of a metric.
Labels
Labels provide a mechanism for adding additional information to each metric. For example, the bbj_sql_statements counter uses labels to identify the data such as database, user, statement type, and success/failure.
It's important to remember that the more labels, the more system resources are required to manage these metrics. BBjServices keeps all metrics in memory (cleared when restarted) and each additional label means that there will be additional objects required for grouping the various labeled metrics together.
Counters
A counter is a cumulative metric that represents a numerical value that only increases. A counter is typically used to count requests, interactions, operations, tasks, errors, etc. Counters should not be used to export current counts of items when the value can increase or decrease over time (e.g. number of BBj processes). Use gauges in this case. The getMetricCounter() method on BBjAPI returns an io.prometheus.Counter instance. See Prometheus JVM Client readme for complete details on available methods.
Example
|
Gauges
A gauge represents a numerical value that can increase and decrease over time. The getMetricGauge() method on BBjAPI returns an io.prometheus.Gauge instance. See Prometheus JVM Client readme for complete details on available methods.
Example
|