BBjServices Metrics
Access to this feature requires an active Software Asset Management (SAM) subscription. See Benefits of ‘Software Asset Management' Feature Line.
For an overview on how to use metrics in BBj, see BBj Metrics Overview. BBjServices provides access to many metrics, but licensing metrics are accessed via the license server (See BASIS License Service Metrics).
The following metrics are available from BBjServices:
BASIS License Manager (Superseded)
For BLS Metrics, see BASIS License Service Metrics. Metrics about the BASIS License Service are obtained from the license server, rather than from BBjServices.
| BASIS License Manager Metric | Description |
|---|---|
| bbj_blm_in_use | The number of licenses currently in use at the time the metrics endpoint URL is accessed. |
| bbj_blm_count | The number of licenses in the subscription at the time the metrics endpoint URL is accessed. |
BBj Processes
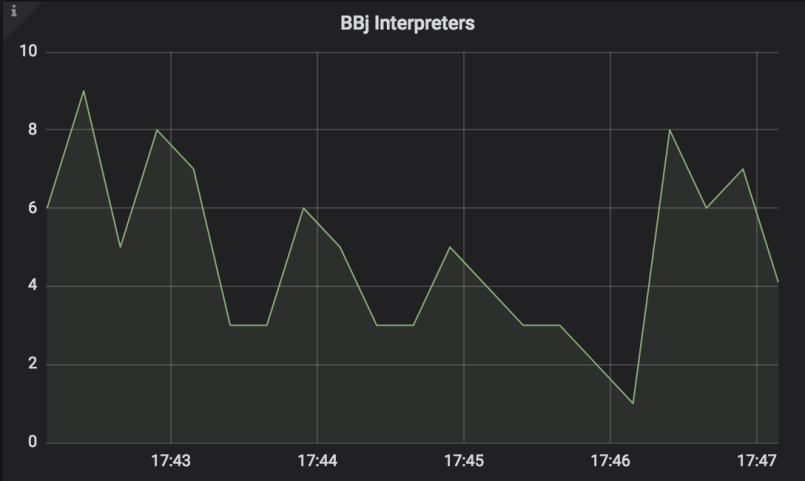
The core of BBjServices is the application server running BBj applications. To import dashboards related to monitoring BBj Processes, see the section “Importing Existing Dashboards” below. Use dashboard ID: 5417 to import the BBj Interpreters and SQL Activity dashboard.
| BBj Processes Metric | Description |
|---|---|
| bbj_running_processes | The bbj_running_processes is a gauge increased and decreased as BBj interpreters are started and terminated. When the metrics endpoint is queried, the current number of running processes is returned. This information is useful to monitor interpreter load at a variety of points in time. |
Example 1
Display the number of processes running over the course of the business day:
bbj_running_processes[5m]
Example 2
Another useful scenario would be monitoring the change in the number of running processes over the course of time:
increase(bbj_active_sql_connections[5m])
BBj Services Information
The BBjServices System metrics consist of information that does not continuously update such as the start time, build date, version, etc. This category of metrics is always enabled since it is very minimal in its impact on resources.
| BBj Services Information Metric | Description | ||||||||||||||||||||||
|---|---|---|---|---|---|---|---|---|---|---|---|---|---|---|---|---|---|---|---|---|---|---|---|
| bbj_info |
Returns various information related to the BBjServices instance. This is a gauge with several labels including:
|
||||||||||||||||||||||
| bbj_start_seconds | Gauge indicating the BBjServices start time in seconds since the epoch (January 1, 1970). |
Filesystem
| Filesystem Metric | Description |
|---|---|
| bbj_filesystem_connections_count |
The current number of filesystem connections at the time the metrics endpoint URL is accessed. |
| bbj_filesystem_connections_total |
The total number of filesystem connections made since starting BBjServices at the time the metrics endpoint URL is accessed. |
| bbj_filesystem_open_files_count |
The current number of open files at the time the metrics endpoint URL is accessed. |
| bbj_filesystem_open_files_total |
The total number of files opened since starting BBjServices at the time the metrics endpoint URL is accessed. |
JVM Details
BBjServices includes the option of exporting various JVM metrics. BBj uses the standard JMX client metrics from the Prometheus client library. These metrics begin with the prefix jvm_. A detailed description of each is beyond the scope of this documentation. However, for those familiar with JVM’s, most are self-explanatory by the name of the metric and/or the description.
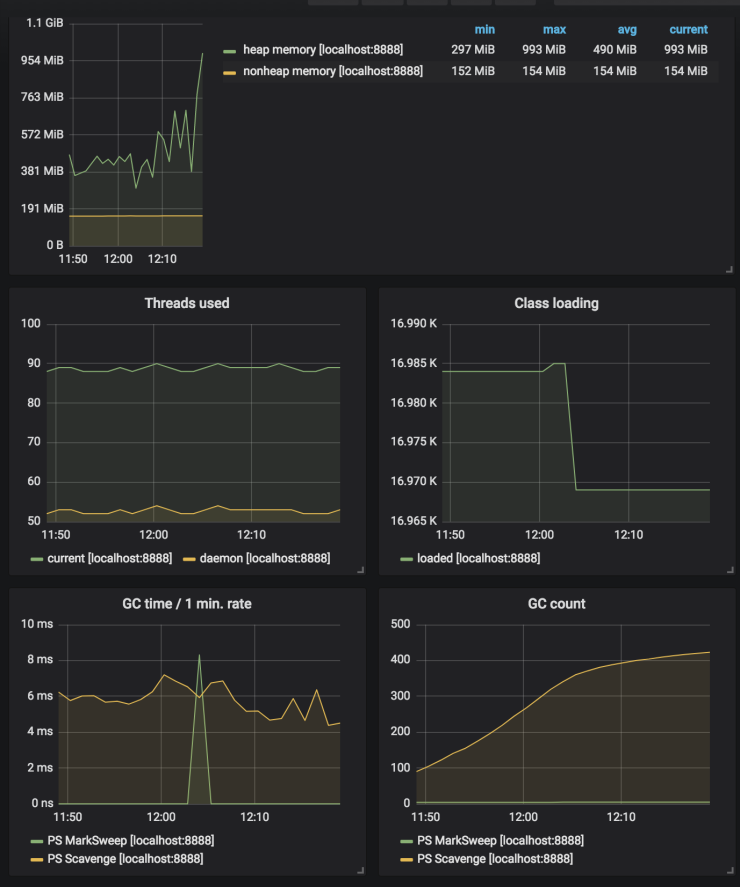
Grafana provides a convenient dashboard, preconfigured to display useful information. The dashboard is easy to install using the import feature. To import the following JVM dashboard, see the section “Importing Existing Dashboards” below. Use dashboard ID: 3066 to import the JVM overview - Prometheus dashboard.
The following shows an example of the kinds of graphs in this dashboard:
Replication includes a number of metrics for monitoring the state of replication jobs. Typically, all metrics would not fit well on a single dashboard panel, nor are most metrics necessary or useful in all circumstances. The table below provides a brief description of each metric to help the administrator determine the information necessary for their particular monitoring needs:
| Replication Metric | Description |
|---|---|
|
bbj_replication_bad_file_count |
The number of files currently in a problematic state. Use the Enterprise Manager or Admin API for more details. |
|
bbj_replication_copy_aborted |
The number of files the job failed to copy from the source to the target. |
|
bbj_replication_copy_running |
The number of files the job is currently copying. |
|
bbj_replication_copy_waiting |
The number of files currently waiting to be copied (in the queue). |
|
bbj_replication_disabled |
0 or 1 indicating whether the job was disabled at the specific point in time. |
|
bbj_replication_has_error |
0 or 1 if the job is currently in an error state. Specific details of the error should be acquired via the Enterprise Manager or Admin API. |
|
bbj_replication_last_confirmed_serial |
Last serial number confirmed by a job target. |
|
bbj_replication_last_timestamp_bad_file_count |
Last timestamp number of bad files for a job. |
|
bbj_replication_last_timestamp_copying |
Last timestamp number of files being copied. |
|
bbj_replication_last_timestamp_interval_seconds |
Last timestamp interval from previous timestamp for a job. |
|
bbj_replication_last_timestamp_op_count |
Last timestamp number of operations processed by a job. |
|
bbj_replication_last_timestamp_op_rate |
Last timestamp operations per second for a job. |
|
bbj_replication_last_timestamp_ratio |
Last timestamp ratio of timestamp time to wall time for a job. |
|
bbj_replication_last_timestamp_seconds |
Last timestamp processed by a job. |
|
bbj_replication_last_timestamp_wall_interval_seconds |
Last timestamp interval from previous timestamp for a job. |
|
bbj_replication_last_timestamp_wall_seconds |
Last timestamp wall time processed by a job. |
|
bbj_replication_last_wait_for_log_seconds |
The last time a job waited for the operation log. |
|
bbj_replication_recopy_disabled |
0 or 1 if the recopy feature is disabled for the job. Recopy checks the state of file(s) on the source and target to determine if changes have occurred to one or the other that requires the entire file to be recopied from the source to the target to return them to a synchronized state. This will typically only be disabled in cases where a problem exists and is causing a file or files to be recopied over and over. |
|
bbj_replication_synchronous |
0 or 1 if the replication job is synchronous. This is almost always 0 and is not likely something most users will find interesting. |
SQL Connections
To import dashboards related to monitoring SQL connections, see the section “Importing Existing Dashboards” below. Use dashboard ID: 5417 to import the BBj Interpreters and SQL Activity dashboard.
| SQL Connections Metric | Description |
|---|---|
| bbj_active_sql_connections |
The bbj_active_sql_connections metric is a gauge that is updated each time an SQL connection is opened or closed. The value of the gauge is always the total, current number of active SQL connections on the BBjServices installation. |
Example 1
Display the total number of active SQL connections (includes SQLOPEN, JDBC, and ODBC), updated every 5 minutes:
bbj_active_sql_connections[5m]
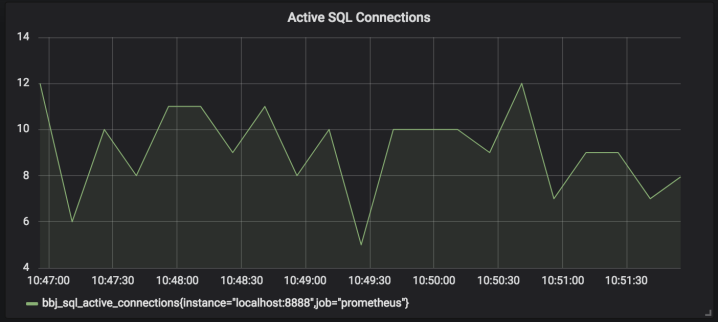
This graph shows that there are typically 5-12 active connections at any given moment.
Example 2
Another query of interest would be the change in the number of active connections every 5 minutes (i.e. 5 minutes ago there were 120, now there are 137, so we see a value of 17):
increase(bbj_active_sql_connections[5m])
SQL Statements
"Dashboards" below. Use dashboard ID: 5417 to import the BBj Interpreters and SQL Activity dashboard.
| SQL Statements Metric | Description | ||||||||||
|---|---|---|---|---|---|---|---|---|---|---|---|
|
bbj_sql_statements |
The bbj_sql_statements metric is a counter that is incremented each time an SQL statement is executed, labeling the information with the following for easy grouping purposes:
Using these labels, one can generate a dashboard showing the number of statements executed on a particular database over the course of time, the number of UPDATE statements executed on each database, statement execution grouped by user, etc. |
Example 1
Display the number of statements executed every 5 minutes on the ChileCompany database. Show a graph line for each unique label combination (i.e. a line for {user=jdoe, type=SELECT, success=true} and another line for {user=jdoe, type=UPDATE, success=true} and still another for {user=jsmith, type=SELECT, success=true}:
increase(bbj_sql_statements{database='ChileCompany'}[5m])
This example could potentially become unruly depending on the number of users and statement types executed. A more useful way of using this type of query might be to specify a value for additional labels (i.e. display only the data for user jdoe):
increase(bbj_sql_statements{database='ChileCompany',user='jdoe'}[5m])
Example 2
Display the number of all types of SQL statements run on the ChileCompany database every 5 minutes, grouping all of the users and types together, but include a separate line for success/failure:
sum(increase(bbj_sql_statements{database="ChileCompany"}[5m])) by (database, success)
This is likely more useful as it shows total load on a given database with the only separation being success/failure.
Example 3
A modified version of Example 2 where we view the number of statements executed every 15 seconds for ALL databases, grouping the totals by database and success/failure:
sum(increase(bbj_sql_statements[15s])) by (database, success)
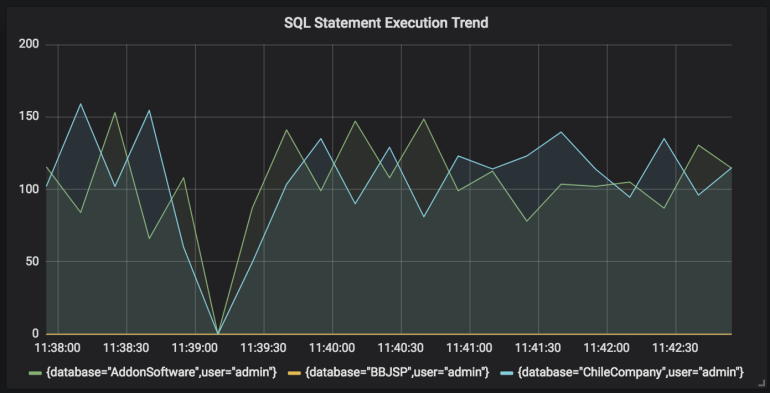
This graph shows that there are typically 80-150 statements executed every 15 seconds on both the ChileCompany and AddonSoftware databases. Note the steep drop at one point which indicates there were no statements executed during that short segment of time.
SQL Stored Procedures
To import dashboards related to monitoring SQL stored procedures, see the section “Importing Existing Dashboards” below. Use dashboard ID: 5417 to import the BBj Interpreters and SQL Activity dashboard.
| SQL Stored Procedures Metric | Description | ||||||||||
|---|---|---|---|---|---|---|---|---|---|---|---|
| bbj_sql_stored_procedures |
The bbj_sql_stored_procedures metric is a counter that is incremented each time an SQL stored procedure is executed via a CALL statement (whether standalone or embedded in a nested SELECT statement). The information is labelled with the following details for easy grouping purposes:
Using these labels, one can generate a dashboard showing the number of SPROCs executed on a particular database over the course of time, the number of executions of a specific SPROC, execution grouped by user, etc. |
Example 1
Display the number of SPROCs executed every 5 minutes on the ChileCompany database. Show a graph line for each unique label combination (i.e. a line for {user=jdoe, sproc=ITEM_DETAIL, success=true} and another line for {user=jdoe, sproc=CUST_DETAIL, success=true}, etc.:
increase(bbj_sql_stored_procedures{database='ChileCompany'}[5m])
This example could potentially become unruly depending on the number of users and SPROCs executed. A more useful way of using this type of query might be to specify a value for additional labels (i.e. display only the data for user jdoe):
increase(bbj_sql_stored_procedures{database='ChileCompany',user='jdoe'}[5m])
Example 2
Display the number of all types of SPROCs executed on the ChileCompany database every 5 minutes, grouping all of the users and SPROCs together, but include a separate line for success/failure:
sum(increase(bbj_sql_statements{database="ChileCompany"}[5m])) by (database, success)
Services
| Services Metric | Description |
|---|---|
| bbj_service_connections |
The current number of socket connections to a particular service at the time the metrics endpoint URL is accessed. |
| bbj_service_connections_total |
The total number of socket connections made to a particular service since starting BBjServices at the time the metrics endpoint URL is accessed. |
| bbj_service_running |
0 or 1 if the service was running at the time the metrics endpoint URL is accessed. |
| bbj_service_tls_connections_total | Total number of TLS socket connections for a service |
| bbj_service_failed_tls_connections_total | Total number of failed TLS socket connections for a service |
| bbj_service_invalid_clients_total | Total number of invalid client connections for a service |
| bbj_service_handshakes_total | Total number of handshakes for a service by type |
| bbj_service_failed_handshakes_total | Number of failed handshakes for a service by type |
| bbj_service_logins_total | Total number of logins for a service by type |
| bbj_service_logins_count | Current number of logins for a service by type |
| bbj_service_requests_total | Total number of requests for a service by type |
| bbj_service_requests_count | Current number of requests for a service by type |
See Also
See the BBj Object Diagram for an illustration of the relationship between BBj Objects.