General Ledger - Appendix C – Financial Report Formatting
The General Ledger module includes a Profit and Loss Statement and a Balance Sheet based on account types and account breaks. For many companies, these financial reports are sufficient. For more complex companies, the General Ledger module offers a complete financial reporting system that can be used to format financial reports to their specifications, as well as generate departmental, divisional, and even multi-company consolidations.
Financial report generation is an integral part of the General Ledger module. This appendix gives an overview of the financial reporting system, how it operates, and examples of how to set up reports. Together with the Financial Reporting information in the Operations section, this information will provide the required knowledge. In addition, this appendix contains examples of how to set up and link financial reports.
Setting up the financial reports is not a prerequisite of the General Ledger module. The standard Profit and Loss Statement, and Balance Sheet are generated directly from the chart of accounts and can be used until custom reports are formatted. The best method of installing the General Ledger module is to get the general ledger portion operational and balanced before attempting to set up the financial reports. Review this section briefly before continuing in order to gain general understanding of how the financial reporting system operates. Just before setting up the financial reports, re-read this section again carefully.
Overview
The AddonSoftware financial reporting system is a powerful report generator that can access all general ledger information, and allows the creation of many useful financial report formats.
A common way of producing financial reports is to take the chart of accounts and sort it (or sections of it) in various ways, and produce reports that are dependent upon the format, organization, and descriptions of the general ledger accounts themselves. Unfortunately, this does not reflect the real world requirements for financial reporting. Financial information often needs to be viewed differently than the accounting format of a chart of accounts.
To overcome this problem, the financial reports produced by the AddonSoftware General Ledger are defined independently of the chart of accounts format. For each company, up to 99 financial reports may be defined. There is also the ability to produce consolidated financial reports for multiple companies. The consolidated reports can have a format that is different than that of any of the individual companies making up the consolidation.
After the financial reports are defined and the chart of accounts has been established, they are "linked" together by assigning each account number to one or more lines on a financial report. In addition, information may be "linked" within a single financial report as well as between individual reports.
Because some industries require analysis of both dollar and unit quantities, the General Ledger has been designed to accumulate both dollars and units. This information, as well as ratios between the two, may be included in the financial reports.
How Financial Reports Work
Account information is extracted from the general ledger summary information and placed in the financial report files. This process is called the financial report "update." The update requires selection of a specific accounting period and that the operator indicates which reports are to be printed.
The update does the following:
-
The period-to-date, quarter-to-date and year-to-date summary transactions for the current and previous year are accumulated for each general ledger account.'To-date' means through the selected fiscal period. Budget and unit information, when maintained, is also accumulated.
-
The financial report line(s) assigned to each general ledger account are examined and the dollars and units are accumulated to the line. The type of account is checked to determine if it is an asset, liability, capital, income or expense. The numeric sign of liabilities, capital, and income accounts (normally stored as negative numbers) are automatically reversed so numbers on the financial reports will appear as positives.
-
When percentage calculations are required by the financial report line, the denominator for these calculations is accumulated at this time. A full explanation of percentage calculations is given later in this Appendix.
-
The selected reports are printed in numeric sequence, regardless of the specified sequence. While the reports are being printed, the totals in each are calculated and stored in the financial report file. It is important that all of the lines used to generate a total be printed prior to the results of that line.
Financial Report Updating Example
A company has five different bank accounts and each one is represented by a general ledger account number. On the balance sheet, these accounts are to be combined into a single line called Cash. As the update reads each general ledger account, the amounts are accumulated for each of the five bank accounts. The report and line number (cash) assigned to the general ledger account is updated. In this case the general ledger account for each bank account would have the same report and line number. Finally, the balance sheet (along with any other reports selected) will be printed.
After updating and printing the entire set of financial reports at least once, they may be reprinted without having to rerun the update procedure. However, in omitting the update process, any general ledger information that has changed since the previous financial report printing will not be included in the reports.
How Financial Reports are Interrelated
It is important to understand the concept of how custom financial reports relate to each other. Because information on one report may be required on another for it to be accurate, it is important to organize the order in which they are generated. When one report requires information from another, the calculations of the report where the information first appears must be completed before the later report can be printed. The final calculations for the reports take place as they actually print.
Each report has a two-digit identification number that controls the order in which the update and printing takes place. Therefore, the first report must have a lower identification number than the second so that its calculations are done first and will be available to the second report. When reports are printed selectively or when the reprint option is used, care must be taken that lower numbered reports have been printed at least once in order for their information to be available to subsequent reports.
Financial Report Example 1
The balance sheet uses the year-to-date net profit figure that is calculated on the income statement to make the retained earnings figure correct. The income statement must therefore precede the balance sheet. The income statement might be defined as report 10. The balance sheet might be defined as report 90.
Financial Report Example 2
A detailed departmental expense report lists each general ledger expense account used within the department. Several of these individual departmental expense reports are to be combined into another report that has a single line for each department's total expenses. The detailed departmental expense reports must be assigned lower report numbers than the summarized expense report.
How to Define the Heading Information
The heading information for the financial reports describes the general attributes of information presented on the report. Within the financial report heading, the format used for the printing of dollars, units, percentages and ratios are described. Up to eight columns of information may be defined for each individual report.
Report Number and Description
A two-digit report number and brief description are assigned to each report. The description is used only for identification purposes and does not print on the report itself.
Heading Number
A two-digit numeric that identifies a heading format used on this (and possibly other) reports. It is common to use the same number for the report and heading, although an alternative is best if using it on more than one report.
Dollar Mask
Defines the format for printing dollars on this individual report. For large dollar figures, consider printing whole dollars only, omitting the pennies. A mask to accomplish this would look like (##,###,###), and would accommodate a company with up to 99 million dollars in sales.
On financial reports, parentheses are the standard method of denoting negative numbers. For more information on defining numeric masks, please refer to the Installation section on setting up the general ledger parameters.
Unit Mask
When using unit quantities such as hours, inventory amounts, or days, as well as dollars on a report, be sure to define the mask to allow for the maximum quantity that may appear. When fractional unit quantities are required, allow for the smallest unit that may occur in the decimal portion of the mask.
Unit Mask Example
The expression "123.45" hours would require a mask such as #,###.00-.
Ratio Mask
When calculating dollars per unit or units per dollar on reports, the maximum size of these ratios must be considered. Remember, when dividing a small number by a larger one, the resulting number may have several significant digits in the decimal position.
Percent Mask
When displaying any percentages on reports, the percentage mask must be set up carefully. Even though percentages may total to 100%, some comparisons may come out much larger or much smaller. Negative percentages are also possible.
Column Number
Up to eight columns may be defined for each report. The column number defines a logical column of information that will appear on a financial report. Each column has five attributes described on the following pages. These attributes are Accounting Period, Actual/Budget, Unit Type, Ratio/Percent and Default Position. They define the type of information that will be printed in each column. Column number 1 does not necessarily have to print to the left of column number 2, etc., although this is the way it is usually organized and the method we suggest. Refer to Default Position, further in these definitions, for more information.
Accounting Period
This is the accounting time period to be used for the column. The choices are:
Current Period
Current GL fiscal period, usually current month.
Current Quarter-to-Date
Quarters begin with the first, fourth, seventh or tenth accounting period (as defined in the general ledger parameters for each company) and include three consecutive periods. The current quarter is the quarter containing the selected GL period. The current quarter-to-date is from the beginning of the current quarter through the selected fiscal period.
Current Quarter-to-Date Example
The fiscal year begins January 1st. When printing the financial reports for the February fiscal period, both January and February figures will be added together and shown in this column. For the December fiscal period, the figures for October, November and December would be included. When the fiscal year began in June, the financial report for the February fiscal period would have figures for December, January and February, since December is the start of the seventh period. In December, the report gives only December figures.
Current Year-to-Date
This will include fiscal year-to-date information through the accounting period selected when the report is run.
Year Ago Period
If the report is for the ninth period of 2008, the time period for this column would be the ninth period of 2007.
Year Ago Quarter-to-Date
If the report is for the ninth period of 2008, the time period for this column would be the seventh through ninth periods of 2007.
Year Ago Year-to-Date
If the report is for the ninth period of 2008, the time period for this column would be the first through the ninth periods of 2007.
Actual/Budget
When choosing Actual, the amounts will be calculated from the summarized figures for periods already closed along with detail postings for the current period. When specifying Budget, the summary budget figures associated with the applicable general ledger account(s) will be used. When specifying Variance, the difference between the budget and actual will be used. (Variance equals Budget minus Actual).
Note: When choosing Actual, the resulting amounts will be based on period-to-date totals or yearly ending balances.
Current Period and Previous Year Same Period will produce figures based on period (usually month)-to-date totals.
Current Quarter-to-Date and Year Ago Quarter-to-Date will produce figures based on period (quarter)-to-date totals.
Current Year-to-Date and Year Ago Year-to-Date will produce figures based on ending balance for those years.
Unit Type
When selecting Amount, the dollars from the above sources will be used. Selecting Unit uses the quantities from the above source.
Unit Type Example
When the column is to represent expenses, dollars should be used; when the column is to represent hours, units should be used.
Ratio/Percent
A ratio is the relationship between dollars and units display in a Choose of four options: Ratio, Percent, $, or %. A division of dollars by units, or units by dollars will be performed, depending upon what was selected for Unit Type above.
When you do not want a ratio, percentage, or variance in the column, enter a space and then press the [Enter] key.
Ratio Example
To print the expenses in a particular department as dollars per hour, set the Unit Type to be Amount and Ratio/Percent as Ratio, and the resulting number would be expressed as units per dollar.
A percentage is the relationship between dollars and dollars or between units and units. Percentages must be defined in a specific detail line in order to appear in a column defined as a Percent. Also, percentages will only appear when a Percent column is specified.
Percentage Example
To express cost of sales as a percentage of gross sales for the period, define a column that specifies Current Period, Actual, Amount and Percent.
When calculating the variance between the previous two columns, enter $ to display it as a dollar amount or % as a percentage.
Default Position
This is the print position where a column should normally be printed on the page. Positions of 0 to 131 are permitted.
Plan the positions of the columns carefully. A column used for dollar amounts will take up more space than for units, ratios, and percentages. Take into consideration the size of the masks, the total number of columns on the report, and the description for each line. Make sure that the print position plus the width of the mask will not extend beyond the right margin of the page and will not overlap another column. When the line descriptions start at the left and are up to 30 characters long, place the first column at position 35, not at 5. The default column positions can be changed for any individual line on a report, if desired.
To define an expense report, use the following information:
Current Month
Actual
Budget
Variance
% of Sales
Cost/Unit Act
The report would be set up like this:
|
Column Number |
Accounting Period |
Actual/ Budget |
Unit Type |
Ratio/ Percent |
Default Position |
|
1. |
Current |
Actual |
Dollars |
Blank |
30 |
|
2. |
Current |
Budget |
Dollars |
Blank |
45 |
|
3. |
Current |
Variance |
Dollars |
Blank |
60 |
|
4. |
Current |
Actual |
Dollars |
Percent |
85 |
|
5. |
Current |
Actual |
Dollars |
Ratio |
95 |
|
6. |
YTD |
Actual |
Dollars |
Blank |
105 |
How to Define Detail Information
The detail information is used to describe each individual line (row) on the financial report. The line description, print position, editing, totaling, and percentage calculation are all controlled from the detail line.
Line Number
Detail lines may be numbered from 1 to 999 within a single financial report. It is recommended that a sufficient increment be left between numbers to allow for the insertion of new lines if the report is later modified.
Line Number Example
Lines are usually numbered 10, 20, 30, 40, etc. This is the line number that is used along with the report number to define the financial report "linkge" from each general ledger account.
Line Type
There are six line types:
|
Heading
|
A heading line is used where only a description will be printed and financial figures are not part of the line. |
|
Detail
|
A detail line contains information transferred from the general ledger accounts during the financial report update process. |
|
Beginning Balance |
A beginning balance line contains the period-beginning value. |
|
Change in Balance
|
A change in balance line contains the amount changed during the period. This varies from period-to-date for balance sheet accounts. It is useful for changes in cash and other reports. |
|
Total
|
A total line contains information acquired from the Total numbers as described later in this section. It may also function as a detail line in that balances from the general ledger accounts may be linked and updated directly to a total line. |
|
Non-Printing
|
A non-printing line is used to perform an editing, totaling or other function without actually printing. It can also be used to document internal comments about the report. |
Description
This is the title or description to be printed for this line on the report. The description may be up to 35 characters in length.
Position
This is the starting print position of the line description. The position may be from 0 to 131. Be certain that the description does not extend off the end of the page when printing.
Editing
Up to 5 editing tasks may be specified for each line. All editing tasks are performed prior to the printing of the line. The editing tasks are as follows:
|
Space |
A single blank line will be printed prior to printing the line. |
|
Underline
|
All columns will be single underlined for the width of the column prior to printing this line. The column width is determined by the mask definitions in the report heading maintenance. |
|
Double Underline
|
All columns will be double underlined for the width of the column prior to printing this line. The column width is determined by the mask definitions in the report heading maintenance. |
|
Page
|
A new page will be started (including a heading) prior to printing this line. The report heading is printed automatically at the start of each new page. |
|
Reverse Sign
|
The sign of all figures in this line will be reversed prior to printing. Reversing the signs affects only the printed output, not any of the totaling operations. |
|
Clear Total
|
The value of all Output Totals (refer to above) assigned to this line are set to zero prior to accumulating. This allows Output Total numbers to be reused. Be sure to check that the current contents of the total number are not required by a subsequent line or report before using this task. |
|
Favorable
|
The sign of any variance column is reversed for this line. Example: When revenue is greater than budgeted, the variance normally appears as unfavorable (since budget minus actual is negative). Using this task will change the calculation to favorable (actual minus budget). |
Input Total
The contents of this field will be printed on this line, unless the line type is non-printing. When any general ledger accounts are linked directly to this line, the figures from those accounts are added together and printed here. For more information, refer to How Totals Work.
Input Percent
The contents of the Input Percent Total are used as the numerator in calculating percentages on report lines. For more information, refer to How Percentages Work.
NOTE: The value of the Input Total is added to the line before the percentage calculation takes place.
Accumulate
If Yes, the contents of the line included in the total Input Percent. If No, the contents are not accumulated as part of the Percent Total. Only 'D' type lines should select Yes.
Total Number
A line detail may affect up to five Output Total numbers.
Output Number
The Output Total number to be affected by the contents of the current line.
Operator
The contents of the current line may be added or subtracted to the total specified by Output Number: "+" adds the current line values to the total, "-" subtracts from the total.
How Totals Work
All numbers on custom financial reports are stored in numeric variables called "Total Numbers." They represent "buckets" where detail and total line information is accumulated and added to or subtracted from, depending on what is specified on the individual lines. They are identified with a number between 1 and 999 when first setting up reports. Every line type can have Total numbers associated with it, and they are global to all report formats within a company.
Input Totals
Assigning a number to the Input Total field of a report line designates a "bucket" that collect the GL account balances. The GL data comes from lines on the report which use that same number as an Output Number, plus any accounts linked directly to that line. Input numbers are usually assigned to total-type lines. For example, a line using input total 10 will collect and total together all detail lines using output number 10.
Output Numbers
Assigning a number or numbers to the Output No field(s) of a report line designates GL account balances to be collected and totaled at input numbers that are the same. Output numbers are normally assigned to detail-type lines. For example, all detail lines having output numbers of 20 are totaled at input number 20.
How Percentages Work
Percentages are useful in quickly assessing relationships between various figures on a financial report. However, calculating percentages often requires total amount (such as total sales) before the individual line percentages (such as sales and expense categories) can be determined.
To accomplish this, a different type of Total Number called a Percent Total is used. Percent Totals also represent "buckets" where information from the Input Percent fields of detail lines is accumulated, but they are separate from input and output totals and do not behave in the same manner. Assigning a number to an Input Percent field is for an identifier only, not an actual percent. Percent Total 15 is not the same as Total Number 15. Operations involving input and output totals, such as clearing, have no effect on them. Any Percent Total is available to any report, so do not use the same number again thinking that it will calculate a new basis for percents.
Every financial report line involved in a percent calculation must have a Percent Total associated with it in order to be included. When a calculation is being done, the figures associated with a report line are used as the numerator. The denominator is contained in a Percent Total associated with the line as the Input Percent. When multiple lines are involved, the Percent Totals are used to accumulate the denominator required to complete the calculation. This occurs during the financial report update process.
Creating a Custom Financial Report
-
Make sure the GL chart of accounts is finalized and that the account numbers are correct.
-
Plan the reports in advance. What information does the company need to see and how many reports will be required? Which reports will share Input and Output Totals, percents and ratio numbers? Lay out the proposed reports on paper and "desk check" the design. It is also useful to set up worksheets with columns showing account numbers, descriptions, report numbers and required information. This helps to visualize the finished report and provides the necessary information for data entry."
-
Set up the report format using the Financial Report Master task. Define the heading in Heading Format Maintenance and the line description/behavior in Detail Maintenance. Print the Report Format Listing to provide a hard copy of your input and help finding setup problems.
-
Add the title information using the Heading Format Maintenance task.
-
Print the report using the Financial Report Printing task. Although it will be incomplete, check it for correct titles, line descriptions, spacing, underlining, position on the page, etc. This is a good time to make any necessary changes.
-
Link the appropriate GL accounts to specific lines on the report using the Account/Report Maintenance task.
-
Print the Account/Report Cross-Reference Report and double-check the assignments to be sure the GL accounts are assigned to the report line numbers correctly.
-
Print the completed report using the Financial Report Printing task. Remember that if portions of this report depend on other reports, those reports must be printed first so that the calculations will be available. Are the amounts correct on each line? Are the percents and ratios (if used) calculating correctly? Is the heading and spacing correct?
The standard income statement and balance sheet on the GL Reports menu can provide a handy cross check to the accuracy of the custom reports. When both are printed for the same fiscal period end, many of the totals should be the same.
Custom Income Statement Example
Suppose you wanted to create five custom Income Statements, each showing income and expenses in a different manner. The first Income Statement might have this basic format:
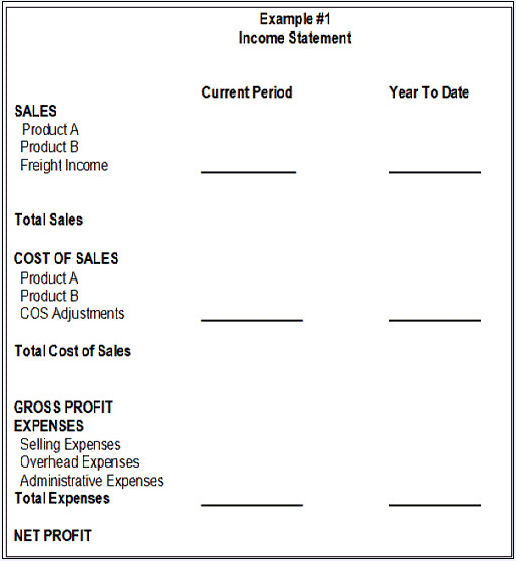
This example shows the basics of what should be planned in advance. If only one or two variations of a report are needed, it may not be necessary to set up a worksheet as discussed in Step 2 of Creating a Custom Financial Report in this appendix. But if there are numerous variations, a worksheet can be a useful tool in placing the right information on each version.
Worksheet Example #2
If you use a worksheet, lay it out so that all of the GL account numbers needed for all variations of a report can be listed. In this case, five different income statements are to be produced. Assign five report numbers (12, 14, 16, 22, and 24). The first one, number 12, will be the format shown in Example #1. The worksheet might look like this:
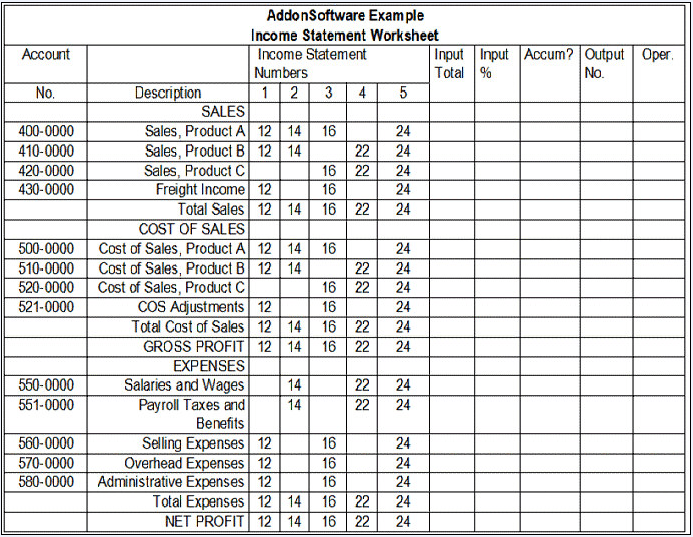
You can see all of the GL account numbers involved, and which ones will be used on which reports. Columns have been established on the right side of the worksheet for assigning Input and Output numbers, accumulation, and operator signs. Make a copy of the worksheet for each report to set up and then complete these columns. When the worksheets are correct, the reports are ready to be entered into the system.
Report Formats
Enter the report number and heading information using the Heading Maintenance task in Financial Report Maintenance. Next, assign line numbers, descriptions, line types, print positions, Input/Output numbers and an Operator (if required) to each line using the Detail Maintenance task. The report title should be added next using the Financial Report Master task.
Input/Output Numbers and Operators
From Example #1 (and the worksheet, if used), verify which lines need to be added together to produce a total. On the Income Statement, Product A, Product B, and Freight Income are detail lines which need to be added together to produce Total Sales. During setup, those three lines are assigned the number 51 in their respective Output No fields.
Whenever output numbers are used, an operator must be assigned indicating whether to add to or subtract from the value in the Output Total. These fields are given the operator "+" which indicates that they should be added together. The Total Sales line is assigned number 51 in its Input Total field, and the three outputs are totaled together here. Since Total Sales will also be part of another calculation (Net Profit), this line is also given an output number (70) and the operator "+". The Cost of Sales section and the Expenses section of Example #1 must also be given input/output numbers and operator signs. It could be set up as shown in the following Example #3.
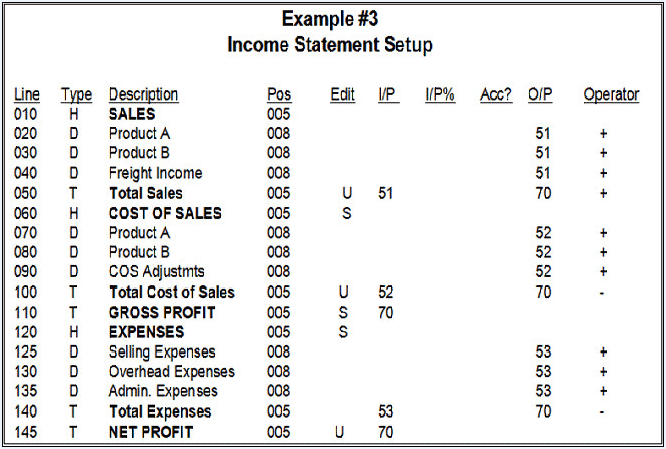
When the Income Statement is set up as shown in Example #3, each line has assigned attributes such as type, description, and starting print position. When choosing line numbers allow enough unused numbers so that new report lines can be inserted later if needed. In the example, line numbers were incremented by ten. When choosing input and output numbers, use different numbers in different sections of the report except in total-type lines. If set up correctly, the report prints exactly as laid out on paper but without numbers or totals. This is a good time to do a test printing of the layout.
Assigning GL Accounts to Report Lines
GL accounts are linked to report lines using Account/Report Maintenance. Each account may be linked to as many as ten different reports, providing a great deal of flexibility. Remember that these assignments can be written over. For example, if you have used assignment #1 to link a specific GL account to a report and line number it cannot be used again for that same account. If you try, a warning message will appear advising that a link will be overwritten and asking if you wish to proceed. There may be valid reasons to write new links over old ones so this is allowable after proper notification.
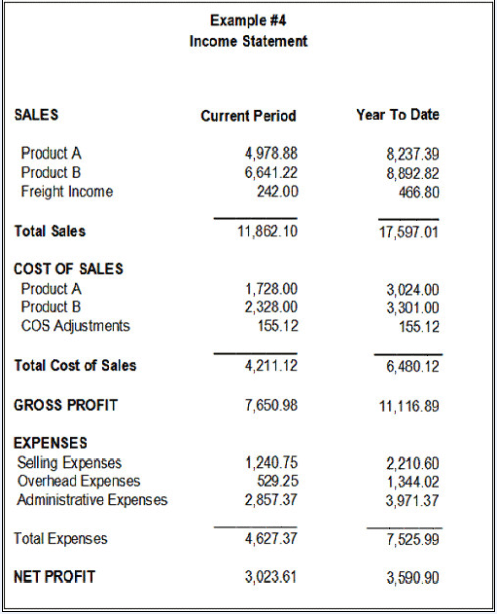
Printing a Report
After all necessary accounts have been linked to lines on a report, print the Account/ Report Cross Reference Report to verify that the assignments are correct. If they are, print the completed report using the Financial Report Printing task. Verify that the amounts on each line are correct. It might look like this:
Adding Percentages to a Report
Percents and ratios are common in most reports, so they should be added to the Example Income Statement. They also require different numbers for accumulating and totaling. Allow enough space between numbers for future report lines, taking into consideration that 999 are available for use on all of the reports. For more information, refer to How Percentages Work in this appendix.
Assume in this example that you wish to see all sales, cost of sales, and expense amounts expressed as a percent of total sales for the current period and year to date. First, the heading must be changed to accommodate four columns instead of two. Using the Heading Maintenance task, add a Current Period and a Year To Date column. In the "Percent/Ratio" field of each, enter the letter "P" so that the system knows this is a percent calculation. The default positions of the original columns will also need to be moved in order to make room for the new columns and their positions.
In the previous example of an Income Statement Setup, the "Input %" and "Accumulate?" columns were left blank. Now they need to be completed, and would look like this when done:
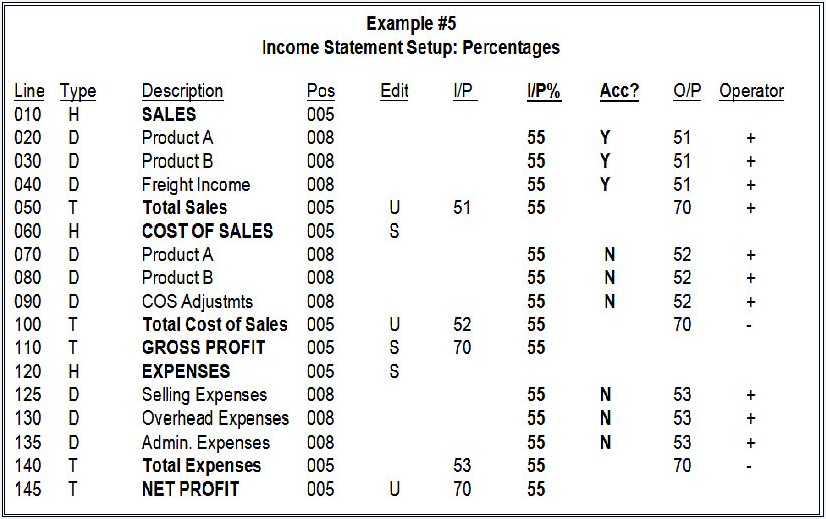
A previously unused number, 55, has been assigned as the Input Percent number. The "Accumulate?" field has been given a Yes designation in the three detail lines which comprise sales, 020, 030 and 040. The amounts on those lines will be accumulated on Total-type line 050, which becomes the denominator for these percent calculations. All other lines where a percent is to appear are also given the number 55, but with the "Accumulate?" flag not set to yes each line will produce a separate calculation based on its percentage of the amount on line 050.
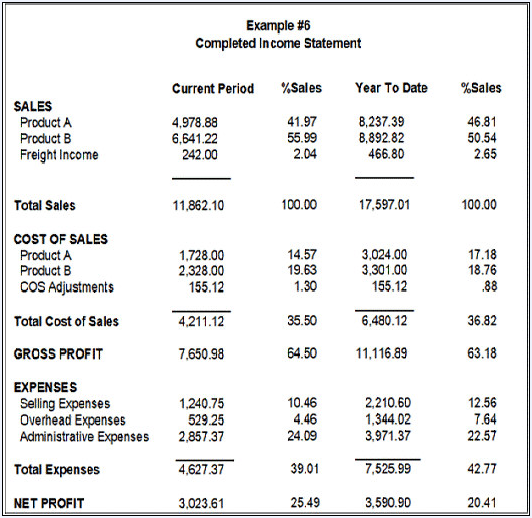
Finally, using the Financial Report Heading Maintenance task, add two "% Sales" titles, which will print on the report above the new percent columns. When completed the report should look like this:
Producing Multiple Company Consolidated Reports
You may use the financial reporting system to produce consolidated financial reports from the general ledgers of multiple companies. To do this, special steps are required:
-
Company 99 has been reserved for the formatting of consolidated financial reports. Define Company 99 and set up the general ledger parameters. It is not necessary to define the chart of accounts.
-
Using Company 99, define the format of the consolidated financial reports just as you would for any company.
-
Use the Consolidated Account/Report Maintenance task to link each company to the set of consolidated financial reports.
-
Select Company 99 and run the consolidated financial reports from Company 99, in the same way that single company financial reports are run.
When more than one level of company consolidation must take place, it can be accomplished within the financial reports defined for Company 99. The method of accomplishing this is to link all subsidiary companies into Company 99 financial reports, using the consolidated financial report linkages provided. Then the various combination of consolidations are performed within the financial reports of Company 99, including the final level of consolidation.
Linking the Chart of Accounts to Financial Reports
Once all financial reports are fully defined and the chart of accounts is complete, assign each general ledger account to one or more lines on the financial reports. Use the Account/Report Maintenance task on the Financial Report Maintenance menu to make the assignments. Refer to the Flow of Processing - General Ledger document.
To help identify the financial report linkage for each general ledger account, use the Account/Report Cross Reference task on the Financial Report Master menu.
______________________________________________________________________________________
Copyright BASIS International Ltd. AddonSoftware® and Barista® Application Framework are registered trademarks.