General Ledger - Financial Report Master
Function
Use this task to maintain the settings which govern the General Ledger's Custom Financial reports. Each Custom Financial report facilitates up to eight columns of information. The amounts for each column can be printed by accounting period, and can be specified by actual/budget/variance, unit type, and ratio/percent/dollars. Use the Financial Report Column Record additional options to access/maintain column and column heading formats. For a more detailed discussion of Custom Financials, refer to Appendix C – Financial Report Formatting.
=> To access this task...
Select Financial Report Master from the Custom Financials menu.
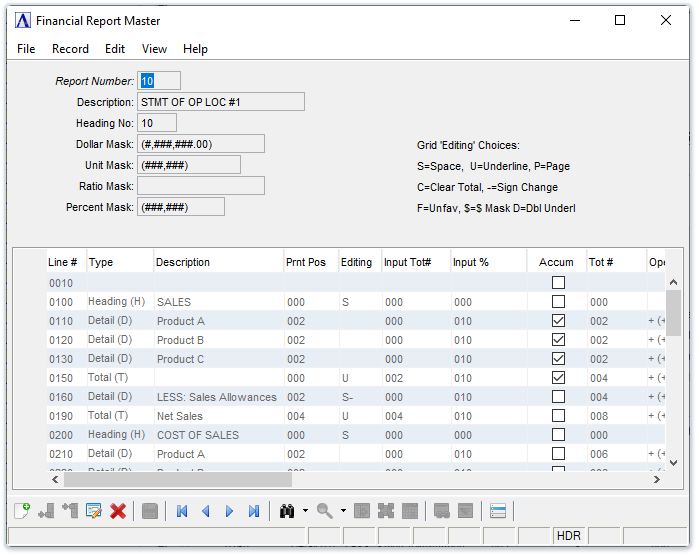
Financial Report Master
About the Fields
In the Report Number field...
-
Enter a two-digit new or existing report number, 01 to 99.
-
Use the binoculars
 or navigation arrows (
 ,
,  ,
,  ,
,  ) to browse through existing records.
In the Description field...
-
Enter a brief description for the report. This description is used for identification purposes only and does not actually appear on the report.
In the Dollar Mask field...
-
Enter the mask to be used for dollar amounts.
This field establishes the format of the dollar mask to be printed on the report. Enter the format of the dollar mask using the following characters: #,.0( ) CRDR. Be sure to allow for the size of totals, the number of columns and negative numbers.
NOTE: The masks that are defined for financial report formatting are separate from the masks defined in the General Ledger parameters.
In the Unit Mask field...
-
Enter the mask to be used for units.
This field establishes the format of the unit mask to be printed on the report. Enter the format of the unit mask using the following characters: #,. 0() CRDR. Be sure to allow for the size of totals, the number of columns and negative numbers.
In the Ratio Mask field...
-
Enter the mask to be used for ratios.
This field establishes the format of the dollars-per-unit or the units-per-dollar mask. Enter the format of the ratio mask using the following characters: #,.0() CRDR. Be sure to allow for the size of totals, the number of columns and negative numbers.
In the Percent Mask field...
-
Enter the mask to be used for percentages.
This field establishes the format of the percent mask. Enter the format of the percent mask using the following characters: #,.0() CRDR. Remember that percentages may sometimes exceed 100% and may be negative numbers.
Detail Line Maintenance
The detail grid is used to define, view, or maintain the detail portion, or main body, of a financial report format. Each line of the report is assigned a type, a description, and an indent/print position. Special editing can also be performed to aid in formatting the report (see the 'Editing' key in the top portion of the form). The source, manipulation, and destination of each amount appearing on the printed financial reports is also established through this option.
In the Line # field...
-
Enter a number up to four digits in length.
This number is a sequential identification number that specifies the relative position of the line on the financial report. Lines should be numbered in steps of 5 or 10 so that additional lines can be easily inserted if necessary.
In the Type field...
-
Select Heading to use this line as a heading line. Heading lines are used to display report titles, subheadings, memos, etc.
-
Select Detail to use this line as a detail line. Detail lines containing the data from the general ledger accounts are added together during an update to find the totals. These are the only line types that will accumulate to a percent total.
-
Select Total to use this line for a total line. Total lines recall and print the totals for each column.
-
Select Non-Printing to use this line as a non-printing line. Non-printing lines do not appear on the report. They are used to indicate a blank line or perform a calculation that should not be printed, though it is used somewhere else in the report.
-
Select Beginning to use this line as a beginning balance line. Beginning balance lines contain the period-beginning balance.
-
Select Change to use this line as a change in the account balance line. This amount reflects the change in value during the period.
In the Description field...
-
Enter a description of the line.
-
Press [Tab] key to access the next field without entering a description.
This field records the line description that is to print on the report for this specific line (e.g., Sales, Cost of Goods, etc.). The description will not be printed when the line is a non-printing line.
In the Prnt Pos field...
-
Enter a number for the indent/print position of the description on the report (typically between 0 and 10). Note that the Description field prints as the first column on the report, with the space to the right reserved for the (up to) 8 amount/units columns, so print positions greater than 30 may not work correctly.
In the Editing field...
-
Enter up to five editing letters or symbols from the list below.
-
Press [Tab] to display this line without edits.
This field is used to specify special functions that can be performed before the line is printed. Punctuation is not needed. The following options are available:
|
- |
Reverses the sign of all columns for the printed output. |
|
$ |
Prints column amounts with a dollar sign displayed. |
|
C |
Clears the output total number before accumulating (prior to printing). (% Totals cannot be cleared.) |
|
D |
Skip one line prior to printing and use it to double underline each column. |
|
F |
Favorable - changes the sign of the budget variance column from positive to negative or vice versa. This is useful when the calculated variance column (Budget-Actual) should be expressed as a positive number. |
|
P |
Move to new page prior to printing. |
|
S |
Skip one line prior to printing. |
|
U |
Skip one line prior to printing and use it to single underline each column. |
In the Input Tot# field...
-
Assign a number from 1-999 as an identifier.
-
Press [Tab] to accept the default of 000.
NOTE: An input number is normally assigned to a total line. When selecting an input number, any amounts in the report assigned an output number the same as the input will be totaled together here.
Input/Output Example
All amounts with an output number of 10 are totaled at input number 10; all amounts with an output number of 20 are totaled at input number 20.
In the Input % field...
-
Assign a number from 1-999 as an identifier.
-
Press [Tab] to accept the default of none.
NOTE: Percent Total Numbers are different from other Total Numbers. Percent Totals prints a percent of several accounts compared to the balances on a detail line or a variance between two columns on a report.
One typical application is to reflect report line balances as a percent of sales. In that case, the total sales line and the detail lines assigned an input percent number will all have the same number. Another is to reflect a variance, in which case the detail lines will all have different numbers assigned.
Accum checkbox...
-
Mark the box for data associated with this line to accumulate into the percent total
-
Unmark the box if the data is not to be accumulated into the percent total.
NOTE: Only 'D' type lines can accumulate to percent totals.
This field determines whether the amounts associated with this detail line should be accumulated into the percent total and used as part of the denominator in the percentage calculation. Detail lines showing sales figures are good examples of lines that should be accumulated.
In the Tot # field...
-
Assign a number from 1-999 as an identifier for each of the total numbers (up to 5) for this detail line.
-
Press [Tab] to accept the default of none.
NOTE: An output number is normally assigned to a detail line. When selecting an output number, any other detail lines in the report assigned the same output number will be totaled together for the input total.
Output/Input Example
All amounts with an output number of 10 are totaled and entered at input number 10; all amounts with an output number of 20 are totaled and entered at input number 20.
In the Oper field...
-
Enter + to add data in this line to the total number.
-
Enter - to subtract data in this line from the total number.
In the Col 1 - Col 8 fields...
-
Up to eight columns can be displayed on a given report. Indicate the number of desired columns by setting the Col <n> value to 1. For example, if a report should have 4 columns, set Col 1 through Col 4 to "1," and leave Col 5 through Col 8 at zero. Note that column data ported in from legacy systems may carry an actual print position of 1 - 131. The actual print positions are no longer used. Any non-zero value is interpreted the same as "1."
-
Press [Tab] for none.
Financial Report Column Record
-
Access the Financial Report Column Record via the Additional Options (
 ) menu on the Financial Report Master form. This task is used to establish the column types and column headings for a report. Up to eight columns can be defined for a report. Each row in the grid corresponds to a column in the report. The amount to be displayed for each column can be printed by accounting period, and can be specified by actual/budget/variance, unit type, and ratio/percent/dollars.
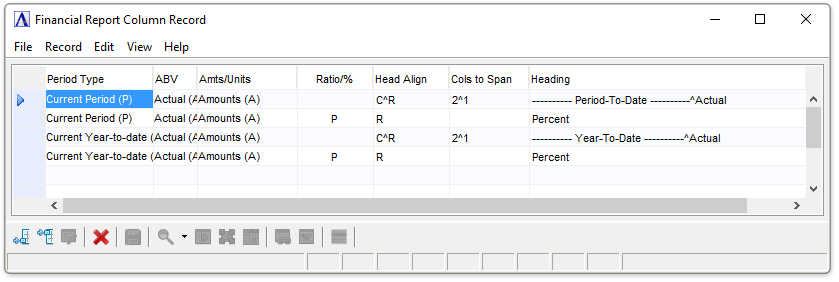
Financial Report Column Record
In the Period Type column...
- Select from the dropdown list the accounting period to use for the column.
Note: 'To-date' means through the selected fiscal period.
In the ABV column...
- Select from the dropdown list the type of amount to use for the column - Actual, Budget, Variance.
In the Amts/Unit column...
- Select from the dropdown list whether Amounts or Units are to be used for the column.
In the Ratio/% column...
-
Enter R to display the amount/unit by ratio.
-
Enter P to display the amount/unit by percent.
-
Enter [ ] to display the amount/unit by dollars.
-
Enter $ to display the amount/unit showing the dollar variance of the previous two columns.
-
Enter % to display the amount/unit showing the percentage variance of the previous two columns.
NOTE: The $ and % variances apply to the previous two columns only. For example, if the first two columns contain dollar amounts, you could use the third column to show their $ variance. You could not use the fourth column to show their % variance, as it applies to the second and third columns.
A ratio is calculated by dividing the unit type specified by the opposite unit type (e.g., if the unit type is to be expressed as a dollar amount, dollars will be divided by units). A percent is calculated by dividing the unit type by the same unit type (dollars by dollars). Variances are calculated by subtracting one of the two previous columns from the other.
If a dollar amount is to be displayed, no calculation will be performed.
In the Head Align column...
Enter the alignment for the heading within the column: C=center, R=right, L=left. The default is R, right justified. For multi-line headings, use ^ (Shift-6) to separate alignments for each line. For example, for a 3-line heading, entering C^L^R will center the first line, left justify the second line, and right justify the third line.
In the Cols to Span column...
Enter the number of columns the heading spans. The default is one and spans just the current column (zero is treated the same as one), . For multi-line headings, use ^ (Shift-6) to separate the number of columns for each line. For example, for a 3-line heading, entering 3^2^1 has the first line span the current column plus the next two columns to the right, the second line span the current column plus the next column to the right, and the third line spans only the current column.
In the Heading column...
Enter the heading text for the column. The heading can consist of actual text (e.g., Statement of Income and Expense), or codes for information added when the report is printed (e.g., [ RDATE] to print the run time date). Codes must be enclosed in brackets ([ ]) in order to be used. The following is a list of available codes, their meanings, and the format that results on the report:
|
Code |
Meaning/(Format) |
|
C-YEAR |
Current Year (20XX) |
|
P-YEAR |
Prior Year (20XX) |
|
MONTH |
Name of Current Month (January, etc.) |
|
QUARTER |
Current Quarter (First, etc.) |
|
C-PERIOD |
Current Period (Period XX From MM/ DD/ YY To MM/ DD/ YY) |
|
P-PERIOD |
Prior Period (Period XX From MM/ DD/ YY To MM/ DD/ YY) |
|
C-END |
Current Period Ending (Period Ending MM/ DD/ YY) |
|
P-END |
Prior Period Ending (Period Ending MM/ DD/ YY) |
|
Y-END |
Month and year (e.g. January, 20XX) |
|
FIRM |
Company Name |
|
R-DATE |
Report Run Date (Run Date MM/ DD/ YY) |
Multi-line headings are created by using ^ [Shift]+6 to specify the line break. For example, these entries...
|
Head Align |
Cols to Span |
Heading |
|
C^L |
2^1 |
---------- Period-To-Date ----------^Actual |
|
|
|
Percent |
...produce these headings for columns 1 and 2:
---------- Period-To-Date ----------
Actual Percent
When done making selections...
-
Click
 to save new information or update exiting information.
 -
Click
 to insert new details at the end of the listing
 -
Click
 to insert new details above a certain row..
 -
Click
 to clear the form and begin again.
______________________________________________________________________________________
Copyright BASIS International Ltd. AddonSoftware® and Barista® Application Framework are registered trademarks.