 EM: BBjServices > Metrics
Description
When double clicked, the Metrics panel shows on the right tab. BBjServices runtime metrics are used for monitoring system performance and server activity. Users can enable or disable individual metric categories including processes, filesystem, replication, SQL activity, and service data from the Metrics panel. Metrics can be enabled without restarting BBjServices, but disabling certain metrics such as JVM Details requires a server restart to take effect. The Metrics Jetty Endpoint section defines the Prometheus endpoint for exporting metrics externally. See: BBj Metrics Overview and BBjServices Metrics.
Location
 EM Navigator →
  BBjServices →
  Metrics
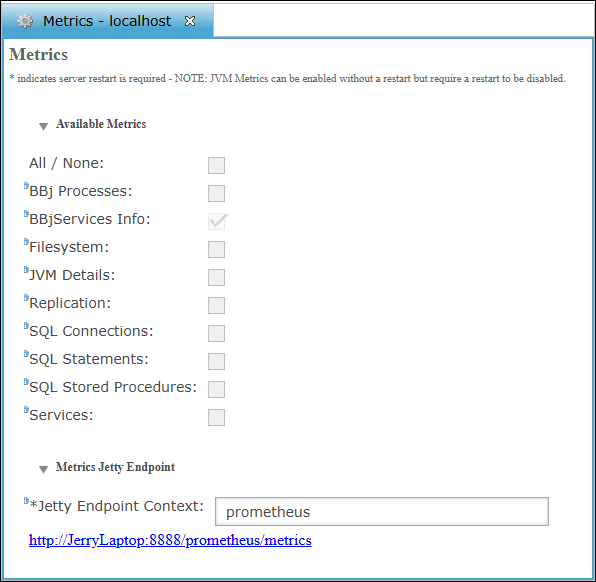
Available Metrics
A configurable list of BBjServices runtime metrics used for Prometheus-based monitoring. Each checkbox enables or disables a specific metric category. The All/None checkbox toggles all metrics at once.
Metrics List
| Setting |
Description |
| All/None |
When unchecked, indicates that no metrics are currently selected.
When checked, indicates that all metrics are currently selected.
|
| BBj Processes |
When unchecked, BBjServices will not export runtime process count data. Prometheus will not receive updates for this metric.
When checked, enables export of the total number of currently running BBj processes on the server. This metric is made available at the Prometheus endpoint using the:
BBj Property Key: <bbj.properties: com.basis.metrics.prometheus.runningProcesses>
|
| BBjServices Info |
Configures static BBjServices metadata such as start time, build date, and version. This metric is always checked by default and cannot be disabled via the configuration UI.
This metric has no corresponding bbj.properties key.
|
| Filesystem |
When unchecked, disables the collection and export of BBj file system metrics, preventing Prometheus from reporting data on open filesystem connections and active files.
When checked, enables reporting of BBj file system metrics, including the number of open filesystem connections, files opened, and currently open files.
This property key can be set in <bbj.properties: com.basis.metrics.prometheus.filesystem> to control whether this metric is collected and exposed via Prometheus.
|
| JVM Details |
When unchecked, disables the collection of JVM metrics.
When checked, enables the collection and export of JVM metrics via the Prometheus client library. This includes data such as memory usage, thread count, and garbage collection statistics. These metrics become available without requiring a BBjServices restart.
Note: Disabling this value requires a restart of BBjServices to take effect, but no restart is required to enable it.
BBj Property Key: <bbj.properties: com.basis.metrics.prometheus.hotspot>
|
| Replication |
When unchecked, disables collection of replication metrics. The system stops exporting replication-related data to Prometheus, and associated metrics endpoint no longer includes this category.
When checked, enables Prometheus to monitor the current state and performance of active replication jobs handled by BBjServices. This includes visibility into replication activity, status, and potential issues.
BBj Property Key: <bbj.properties: com.basis.metrics.prometheus.replication>
|
| SQL Connections |
When unchecked, disables collection of SQL connection metrics. The Prometheus endpoint no longer includes this data, and active SQL connection counts are excluded from monitoring.
When checked, enables tracking of all active SQL connections in BBjServices. Prometheus collects and exports real-time metrics showing the total number of open SQL connections, supporting database activity monitoring and performance.
BBj Property Key: <bbj.properties: com.basis.metrics.prometheus.activeSqlConnections>
|
| SQL Statements |
When unchecked, disables SQL tracking. The system no longer captures execution metadata, and this category is excluded from Prometheus metric exposure.
When checked, enables tracking of each executed SQL statement, including the user, database, statement type and success status. It provides detailed insight into SQL activity across BBjServices and is exposure through the Prometheus metrics endpoint.
BBj Property Key: <bbj.properties: com.basis.metrics.prometheus.sql.Statements>
|
| SQL Stored Procedures |
When unchecked, disables collection of execution metrics for SQL stored procedures. BBj no longer tracks procedure name, user, or success status, and excludes this data from Prometheus metric output.
When checked, enables runtime metrics for all SQL stored procedures executed via CALL statements, including procedure name, invoking user, and success status. The data becomes available for Prometheus retrieval.
BBj Property Key: <bbj.properties: com.basis.metrics.prometheus.sprocs>
|
| Services |
When unchecked, disables service-level metric tracking. No data is collected regarding BBj service activity, and this category is excluded from Prometheus metric collection.
When checked, enables tracking of BBj service usage by type. Service-related metrics become available for Prometheus collection via the Jetty endpoint.
BBj Property Key: <bbj.properties: com.basis.metrics.prometheus.services>
|
Metrics Jetty Endpoint
The Metrics Jetty Endpoint displays the metrics property that can be configured for the Jetty web server. See: BBjServices Metrics.
| Setting |
Description |
| Jetty Endpoint Context |
BBj exports the Prometheus metrics via the built-in Jetty web server at an endpoint defined in this context. The URL defines the Jetty web server endpoint based on the Jetty Endpoint Context name. Accessing this endpoint requires the BBjServices administrator username and password. See: BBj Metrics Overview.
BBj Property Key: <bbj.properties: com.basis.metrics.prometheus.contextPath>
Note: Changing this value requires a restart of BBjServices to take effect.
|
See Also
BBjServices Metrics
BBj Metrics Overview
BASIS License Service Metrics
Metrics: Tell Me About It
BBjAdminBase