
Enterprise Manager: BBjServices > Memory Usage
Description
To access Memory Usage double-click Memory Usage in the BBj EM Navigator and the settings tab will open in the right hand pane.
Java Memory Management
Java memory management continues to provide new and interesting challenges for BBj deployment. To simplify the memory management process, BASIS has added a BBjServices memory graphing function in The Enterprise Manager. This memory-graphing tool parses the BBjServices.out log files and plots the amount of used memory recorded in the files every time a BBj interpreter starts. The best way to use this graph is to view it after BBjServices records several hundred connections. As an opportunistic memory consumer, Java eventually uses as much memory as the administrator allows when the java -Xmx command line parameter is set. By default, the JVM uses 64 MB of memory. Therefore, if BBj runs out of memory, the administrator must increase the -Xmx parameter until BBj runs without generating "out of memory" errors. As the administrator increases the -Xmx value, it is important that the system have enough unused physical memory to accommodate the -Xmx value of the JVM, preventing the OS from swapping out the Java memory to the swap file on the disk.
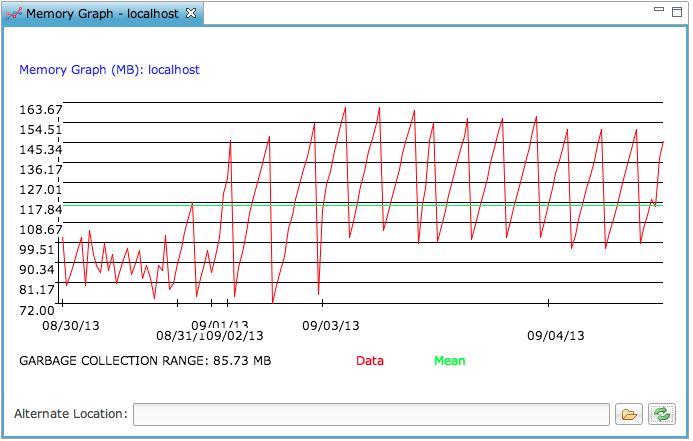
Once BBjServices have enough memory, it is time to start using the memory-graphing tool. Now that BBj has enough memory to run the applications in a production environment, it is possible to begin tuning the amount of memory allocated to the JVM. After hundreds of connections, the memory-graphing tool reveals the garbage collection patterns in the JVM. The pattern is typically saw tooth, which is caused by the JVM's internal garbage collector.
During the normal running of BBjServices, the JVM continuously consumes more memory than the "incremental" garbage collector can free. Once the JVM approaches the upper bound of the -Xmx value, it suspends the running processes, does a full garbage collection, and frees all of the memory not consumed by the running processes. As long as the "full" garbage collection frees 40 to 50 megabytes of memory, users usually do not notice when a full garbage collection occurs. However, if the full garbage collection frees more memory than this, the end users experience application pauses. To provide better performance for the end users, reduce the -Xmx value until the full garbage collections free only 40 to 50 megabytes of memory.
Remember that the changes to the -Xmx value take effect only after restarting BBjServices. The graphing function in the Enterprise Manager automatically applies a standard deviation function that bands the average full garbage collection delta to simplify the tuning procedures. In the past, many releases of the JVM included different garbage collection algorithms, so it is important to monitor the used memory graph after introducing a new JVM in production.
-
Double-click Memory Usage a blank screen appears.
-
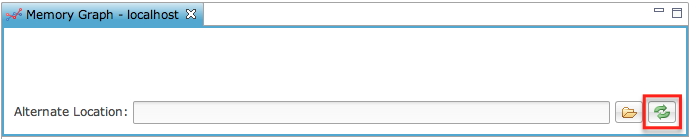
Click the refresh button in the lower right hand corner to display the latest Memory Graph as shown below. Alternately you can select a different location to load log file to be viewed in the Memory Graph by selecting the folder button.
See Also