Performance Analyzer Plug-In Overview
What is the Performance Analyzer?
The Performance Analyzer (PA) is a utility that offers you a high-level view of where your Business BASIC program spent its time during a single execution. This process can help you identify the source of performance bottlenecks in that code.
The PA works by analyzing a trace file created with the SETTRACE verb. SETTRACE writes out information about the execution of each line of code that is executed.
For this discussion, we will focus on the Performance Analyzer plug-in, which is part of BDT Studio, a standalone application that can be installed during BBx installation. You can also use the _prof utilities installed with PRO/5 or BBj to view SETTRACE files if you like; the output is similar.
For BBj 26.00 and higher, accessing the BDT plug-ins in the BDT Studio, a standalone application, supersedes using the Eclipse IDE.
SETTRACE and Trace Output Files
Let us look at a sample Business BASIC program that is set up to trace a portion of its code:
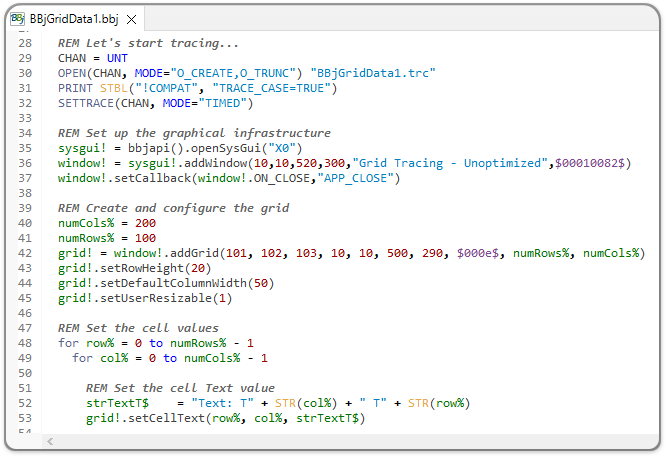
Figure 1. Enabling Tracing in a BBj Program
-
Lines 29 and 30 configure BBjServices to write the trace output to a file named BBjGridData1.trc in the current working directory (since we didn’t specify an absolute path).
-
Line 31 turns on BBjServices’ optional CASE statement tracing (for backward compatibility with PRO/5, CASE statements are by default not traced).
-
Line 32 starts the tracing, which continues until reaching the ENDTRACE on Line 84:
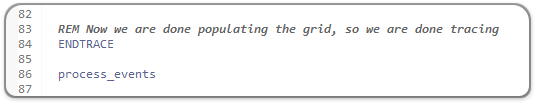
Figure 2. Ending Tracing with the ENDTRACE Verb
Here is an example of the output in a trace file:
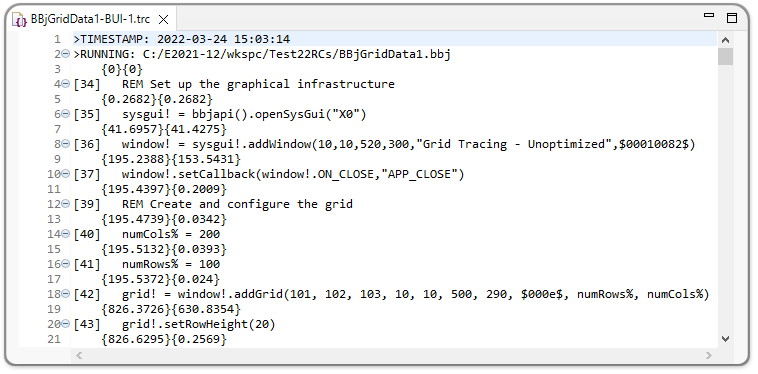
Figure 3. SETTRACE Output
For each line of code that is executed, we see two lines of output. To explain the output, let us look at the eighth and ninth lines of trace output in the screenshot above, which have this text:
[36] window! = sysgui!.addWindow(10,10,520,300,"Grid Tracing - Unoptimized",$00010082$
{195.2388}{153.5431}
-
On the first line, the initial value in square brackets represents the line number in the BBjGridData1.bbj source file; in this example, it was Line 36 (see the first screenshot above).
-
Following that line number identifier is the actual program code for that line (matching the earlier screenshot).
-
-
Indented on the next line are two-time values in curly brackets.
-
The first value is the number of milliseconds that had elapsed (since tracing began) when this line of code finished executing. Line 36 of the code finished at 195.2388 milliseconds after tracing began.
-
The second value is the number of milliseconds that elapsed since the previously traced line of code finished executing. 153.5431 milliseconds elapsed since Line 35 (the preceding trace output line) was executed.
-
Looking further back, we see that the first three lines of trace output in the screenshot above have this text:
>TIMESTAMP: 2022-03-24 15:03:14
>RUNNING: C:/E2021-12/wkspc/Test22RCs/BBjGridData1.bbj
{0}{0}
-
The initial TIMESTAMP on Line 1 provides the time when tracing started. This information can help you tell multiple trace runs/files apart. More on this later.
-
The initial RUNNING output on Line 2 identifies the starting Business BASIC program file (in this example, it shows the full canonical program name for BBjGridData1.bbj).
-
The two {0} times on Line 3 mark the start of tracing. Think of this as the gun going off to start the stopwatch for a race.
Before we look at the Performance Analyzer’s display of the full trace file, there are a couple of things you should know about tracing:
-
The SETTRACE output lists the program statements in the exact sequence in which they were executed.
-
SETTRACE begins line tracing with the next program line following the SETTRACE verb.
-
The tracing stops when the program encounters ENDTRACE, START, STOP, or END in the code.
-
SETTRACE traces the CALLS and EXITS to and from public programs by listing:
-
>ENTERING: program name
-
>EXITING: program name
-
-
This permits the Performance Analyzer to detect and report the correct Program Name for each line it displays.
-
SETTRACE will slow down your program execution (the Observer Effect), and it can generate very large output files. Because of these factors,
-
Trace only the code that you want to optimize now.
-
Do not leave SETTRACE verbs uncommented in your code except while you are actively debugging or optimizing performance.
-
-
Just looking at the SETTRACE output can give you insight into debugging your programs, including branching and looping details.
The Performance Analyzer
The Performance Analyzer summarizes the entries in a trace file and presents the results for easy review. Depending on what you want to see, you can view the information on three tabs:
-
The “All statements” tab.
-
The “Grouped by methods” tab.
-
The “Call Stack Hierarchy” tab.
Let us take a look at those tabs.
The All Statements Tab
The “All statements” tab presents an overview of all of the SETTRACE output lines, as shown in the figure below:
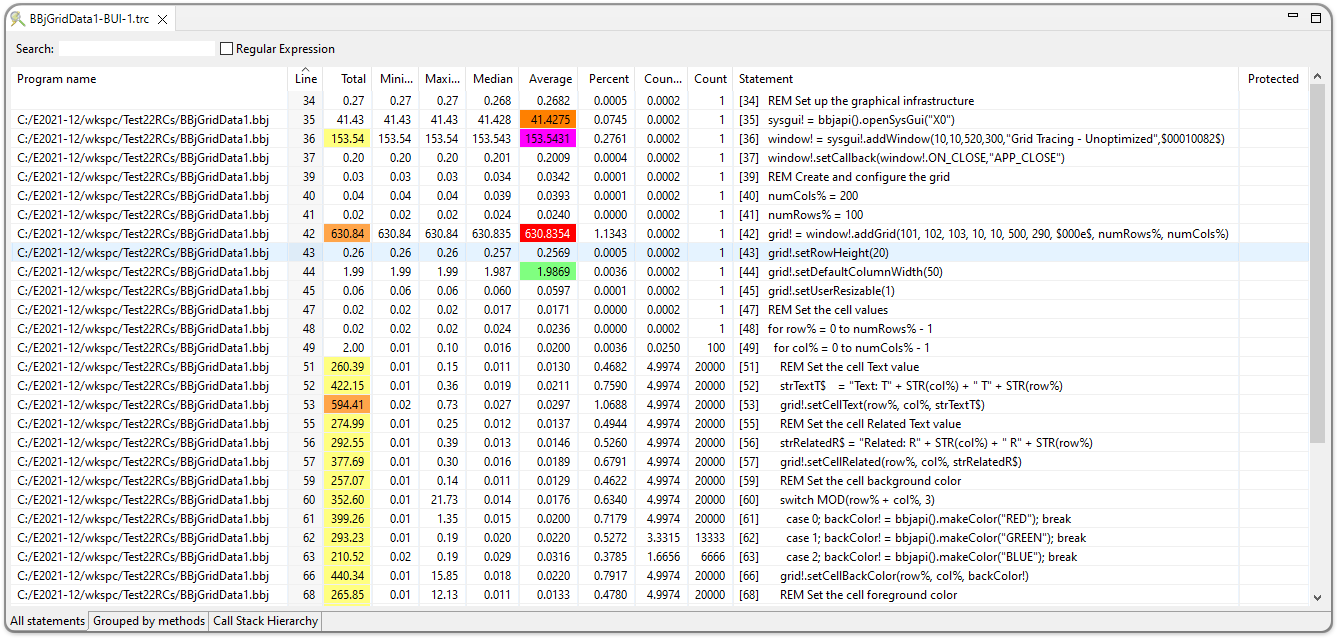
Figure 4. All Statements Tab Sorted by Line Number
For each line of code that was executed at least once, it shows the following values (in default left-to-right column order):
-
The line number (the “Line” column).
-
How many times (N) that line was executed (the “Count” column) during this trace run.
-
The total time reported for that line’s N executions (the “Total” column).
-
The minimum time reported for one execution of that line (the “Minimum” column).
-
The maximum time reported for one execution of that line (the “Maximum” column).
-
The median time reported for all of the N times that line was executed (the “Median” column).
-
The percentage of the total time that elapsed while that line was executed N times (the “Percent” column).
-
The percentage of the total line count contributed by executing that line N times (the “Count percentage” column).
-
The source code present on that line (the “Statement” column).
-
Whether or not this line is in a SAVEP protected source file (the “Protected” column).
In the figure above, the data is sorted by the “Line” column. This makes the order of the entries consistent with the ordering in the source file itself. This can help you to easily find a particular location in the program when, for example, you make multiple runs where you are changing the code.
However, the most useful view to start with is likely sorted by the “Percent” or “Total” column. Either will bring the locations where your program spent the largest amount of time to the top of the table (as shown below sorting by the “Total”):
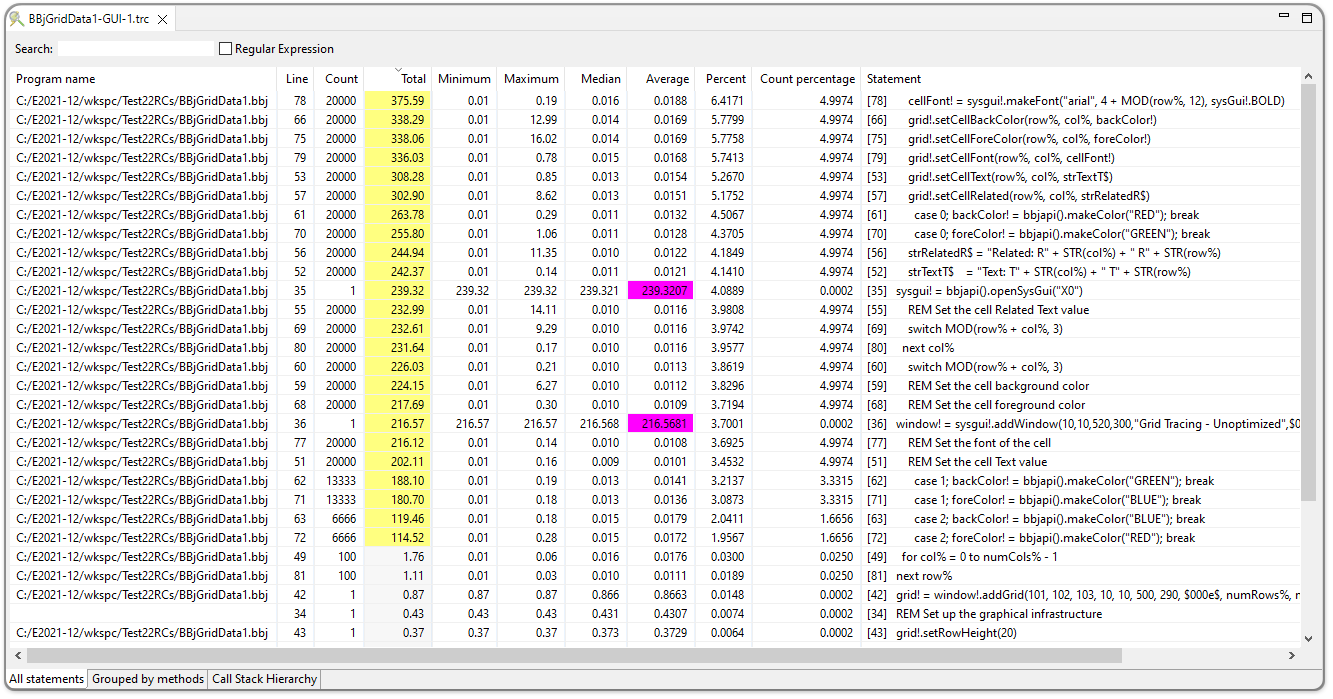
Figure 5. All Statements Tab Sorted by Total Time in Milliseconds
Notice that the top line is now Line 78, where BBjGridData1.bbj spent a total of 375.59 ms over a total of 20,000 executions. Looking at the “Statement” column on the far right, we see:
cellFont! = sysgui!.makeFont("arial", 4 + MOD(row%, 12), sysGui!.BOLD)
This line of code is doing two things, both of which contribute to the 375.59 ms:
-
Executing a MOD() function to calculate a modulus (remainder) value.
-
Making a call to sysgui!.makeFont().
Since the average time was 0.0188 ms (a very small amount of time!), the main reason why the program used 375.59 ms was because of the 20,000 executions (doing something really small enough times can still make it an important factor in performance).
Filtering in the All Statements Tab
The “All statements” tab offers the option to dynamically filter the lines by only showing lines that contain the value you enter in its “Search” field. This can make it easier to find specific lines of code in really large trace files.
Highlighting in the All Statements Tab
In looking at the “All statements” tab, you may have noticed that there are some cells that have different highlighting from the rest. The Performance Analyzer offers Eclipse preferences to configure these highlighting options. You can configure the colors to draw your eye to values that are more important. You can access these preferences in BDT Studio from the Window > Preferences, selecting BBj Utilities > Performance Analyzer in the navigation bar on the left, and then opening the Table Highlighting tab:
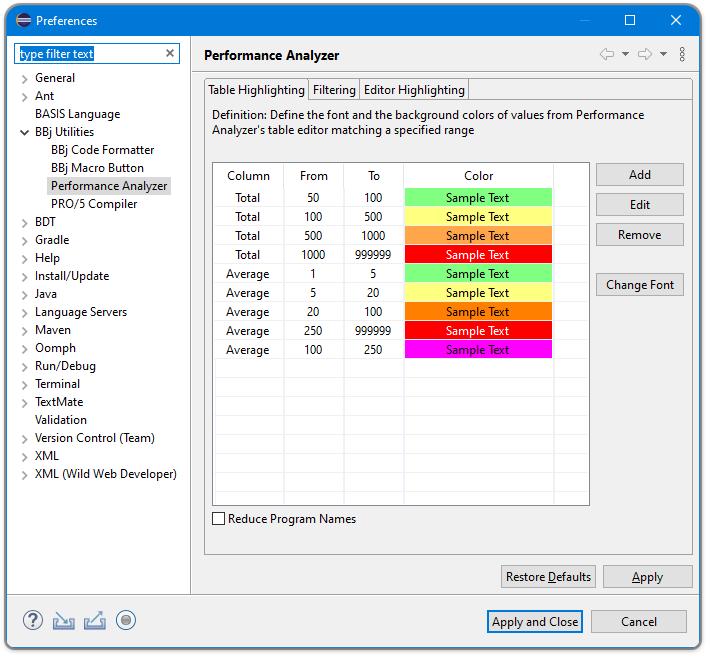
Figure 6. Performance Analyzer Preferences - Table Highlighting
On that same preferences display, you can choose to only see short file names (instead of full canonical names) in the Program Name column by checking the “Reduce Program Names” checkbox.
Highlighting in the Source File Editor
Any time you are in the “All statements” tab, you can double click a line in the table to jump directly to that line of code in an editor. For example, double-clicking the top row (Line 78) in the figure above will cause BDT Studio to open an editor on BBjGridData1.bbj, where it highlights the lines of code according to the settings in the Editor Highlighting preferences tab (see below).
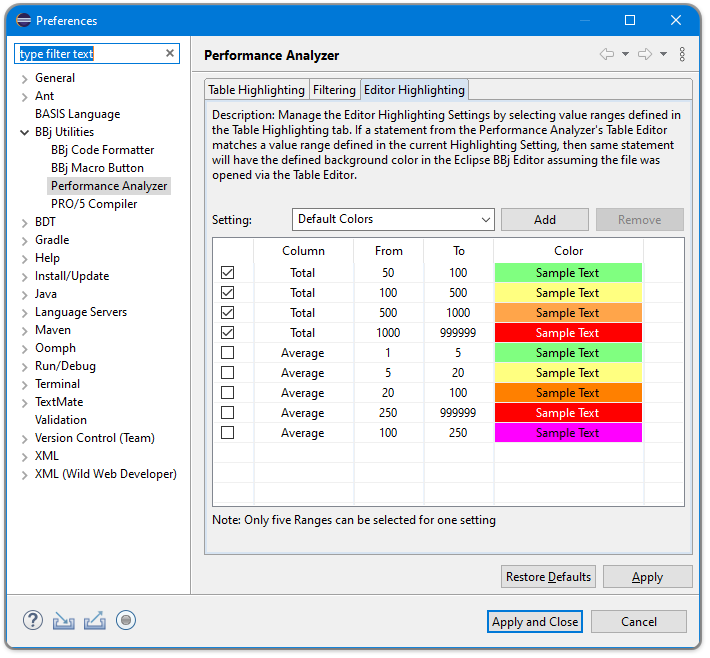
Figure 7. Performance Analyzer Preferences - Editor Highlighting
This highlighting can make it easier to see which lines in your program are contributing the most to the total performance:
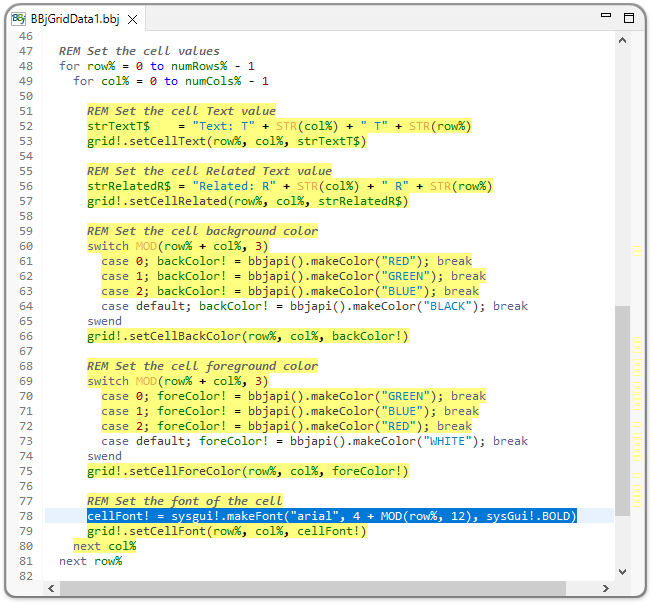
Figure 8. Performance Analyzer Highlighting in the Editor
The Grouped By Methods and Call Stack Hierarchy Tabs
But what if you want the big picture? The “Grouped by methods” tab shows the overall timing for each program file executed during this trace run. In our example, the “~~~Total~~~” for the entire execution is 5,852.96 ms (or just under 6 seconds), as shown on the top row here:
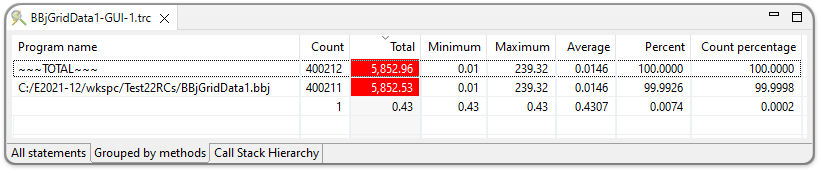
Figure 9. Grouped by Methods Tab
And, in the case where your code makes repeated CALLs to different program files, it is sometimes helpful to see a hierarchical listing of those CALLs. That way, you can see how a particular program was reached with the Call Stack Hierarchy tab.
We won’t be able to spend any time on these last two tabs right now, so we’ll leave those areas for a future article.
Analyzing for Performance
The Performance Analyzer display gives you a visual image of where the program code is spending its time. This information can help you isolate and improve application bottlenecks. Let us take a look at some ways this might happen.
Tips
-
Sorting by the “Total” column can help you find the most expensive lines of code.
-
Sorting by the “Count” column can help you find which lines of code were executed the largest number of times.
-
Sorting by the “Percent” column can help you find which lines of code consumed the highest percentage of the total time.
-
Use the “Grouped by methods” tab to compare the performance for each program file executed during this trace run.
-
The Performance Analyzer traces execution time to the line level in your Business BASIC programs. For more accuracy, when a code line contains multiple statements, break out the statements into separate lines. This will let you narrow down which statement is responsible for what portion of the reported execution time.
-
If you suspect that a sample is spending a lot of time inside one or more Business BASIC functions, you can temporarily enable BBj Function Debugging to generate detailed function execution statistics.
-
Filtering can make it easier to find specific lines of code in really large trace files. There are two ways to filter the lines of code shown in the “All Statements” tab:
-
Add an entry to the Preferences display’s Filtering tab:
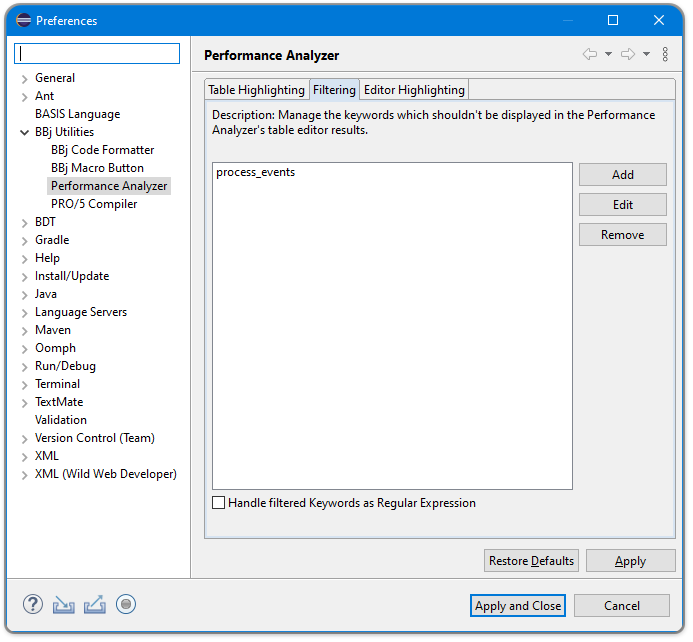
Figure 10. Performance Analyzer Preferences - Filtering
-
The Performance Analyzer will NOT display (it will hide) any line of code containing that text.
-
Enter text in the Search field at the top of the “All Statements” tab (see Figure 4 or Figure 5) causes the Performance Analyzer to ONLY display lines of code containing that text.
-
-
If, after examining the Performance Analyzer output, you don’t see any “low hanging fruit” or obvious bottlenecks (entries with excessively large contributions), then it is possible that your program is already as efficient as practical. If the performance is acceptable, then no further optimization is needed. If not, you can try redesigning it with a structurally different approach.
-
In general, trace a single conceptual task at a time. Typically this centers on calculations and/or I/O, with minimal (preferably no) user interaction (because user interactions can introduce arbitrary delays that can obscure the actual code performance details.
-
It's better to do several focused traces, each looking at a discrete task than large quantities of code that perform different functions. And focus on tasks that feel like they're taking longer than you (or the user) expect; don't randomly go fishing across parts of an application unless you believe that performance is suspiciously poor.
Warnings
-
SETTRACE will slow down your program execution and can generate very large output files. Because of these factors:
-
Trace only the code that you want to optimize now.
-
Only place SETTRACE verbs in your code while actively debugging or optimizing performance.
-
Expect your code to run faster without the tracing enabled.
-
-
Because of startup costs, the first run of your code will likely take longer than subsequent runs.
-
The end users’ perception of performance depends on the network connection between the BBjServices server and those clients. Performance measurements made when the client and the server are on the same computer may be unrealistic unless that is also how your clients will run in production. It is always best to trace your program(s) in the same environment your users will experience. For example:
-
If your end users are running your program in a Thin Client/Remote Desktop configuration over a network, then run SETTRACE in that mode.
-
If your end users are running your program in a browser BUI configuration over a network, run SETTRACE in that mode.
-
-
When an application initiates several client-side operations (e.g., when initially setting up a window), then performs an operation that requires a response from the client, execution might have to wait for backlogged client operations to complete. This can cause SETTRACE to incorrectly report a large execution time for the backlogged operation. Although this behavior produces the best overall performance, it can be misleading when you're trying to isolate which specific line of code is responsible for the most execution time. In this case, consider including the SETTRACE MODE="FLUSH" to fully execute each line of code before continuing. This reduces overall performance, so it should never be used in production, but it can be helpful to narrow down performance questions.
Differences Between the Performance Analyzers
In general, you can use either the Eclipse plug-in or the BBj Performance Analyzer utility. However, there are a few visual and functional differences between them. Here is a list of the most significant differences:
-
The BBj Performance Analyzer shows the TIMESTAMP time in the header, whereas the Eclipse plug-in does not yet do so (look for an enhancement in the future).
-
The BBj Performance Analyzer supports listing tokenized source files as part of the analysis process, whereas the Eclipse plug-in does not.
-
If you are already using Eclipse and the BDT plug-in, then the Performance Analyzer plug-in will be the easiest to use to optimize your programs with repeated SETTRACE executions.
-
Eclipse relies on file extensions to recognize trace files. Your SETTRACE output files must end in .trc to get the full benefit of Eclipse’s project and file management. The BBj Performance Analyzer does not require any particular file extension or any extension at all.
Options for Improving Performance
Once you have identified a location in your program where you want to optimize performance, here are a couple of general options to consider:
-
If you do not really need to do it, stop doing it. In other words, look for ways to decrease the amount of work you are doing while still achieving your program’s goals.
-
If you can, do it more efficiently. Look for ways to combine actions (especially those that require round trips between your client and the BBj server). Also, look for ways to avoid round trips to the server. For example, if the information is available on the client, then it isn’t necessary to ask the server for it.
-
If you can do it fewer times, do so. In other words, pay attention to how many times your code performs actions in loops to see if all of those executions are needed.
Since only you know and understand the goals for your program, only you can identify more specific ways to improve performance. The list above is only a starting point.
Review
Running the Performance Analyzer can help you identify the portions of your code that take the most execution time. In many cases, it may show you what you already expected to see. Or it may surprise you.
But only you know and understand the goals for your program, so only you can find the best ways to improve your program’s performance.