_prof Utility - Performance Analyzer in BBj
The _prof utility is an interactive GUI tool for analyzing timed settrace files. For more information, see SETTRACE Verb - Set Line Tracing.
This utility identifies code that is executed a large number of times or is taking a long time to execute. For example, the screen below shows a short extract from a trace file taken from a run of GUIBuilder:
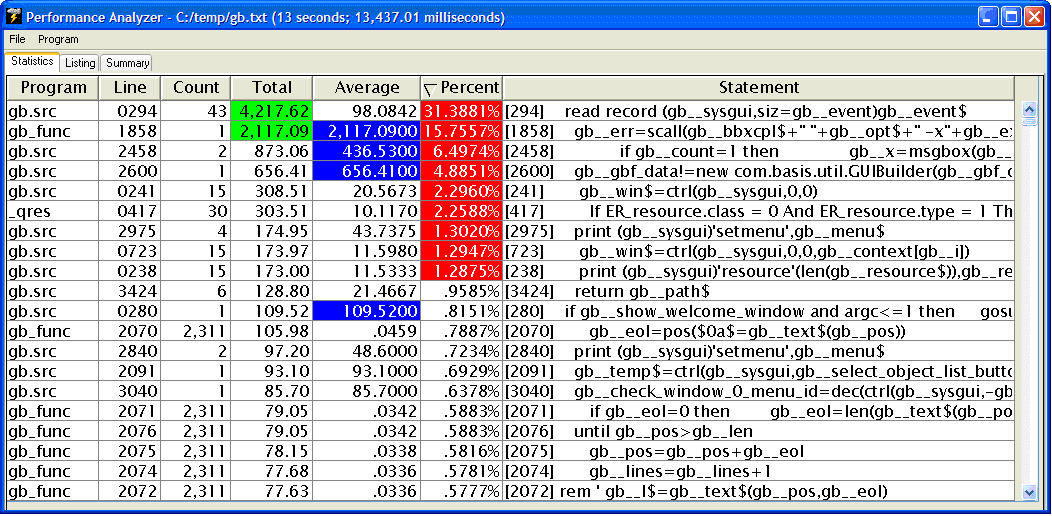
The data is initially presented in descending order of Percent. Single click in a column header to sort the data by any of the following:
Program/Line number
Count (number of times the line of code was executed in this run)
Total (number of milliseconds spent on this line through the course of the run)
Average (Total/Count)
Percent (total time spent on this line)
To toggle between ascending and descending sequence, click the column header a second time.
The color highlight options are set by selecting Program->Highlights from the menu, as shown below:
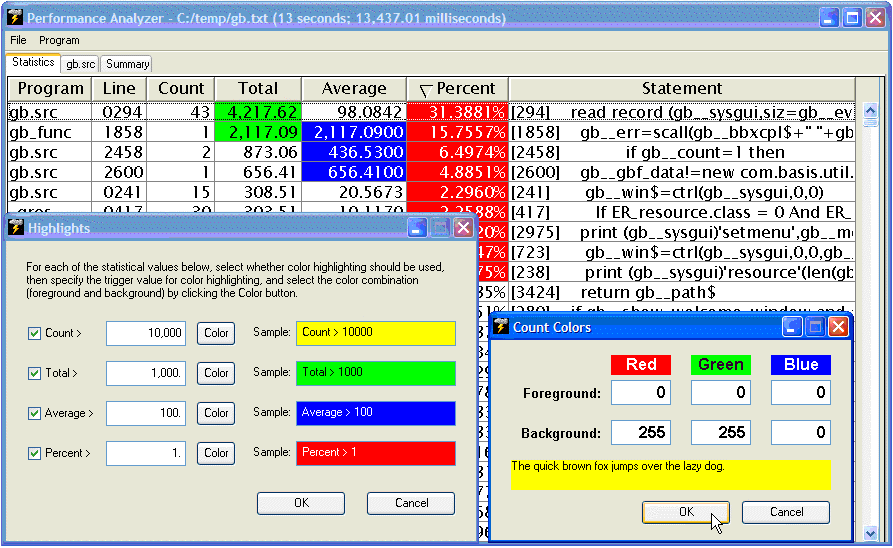
For each of the four numeric columns (Count, Total, Average, and Percent), select highlighting with the checkbox, then set the numeric value to trigger highlighting, and finally, click the [Color] button to set the specific foreground and background colors for each column.
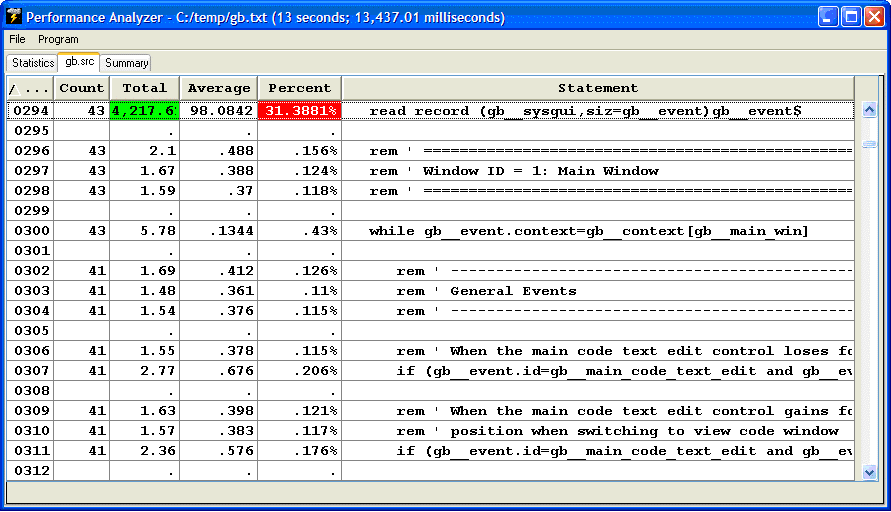
Listing
To see a complete listing for a selected program, double click on any line in the grid. After being prompted for the location of the corresponding program and then selecting that program, a listing is generated and the display shifts to the Listing grid (the second tab). For example:
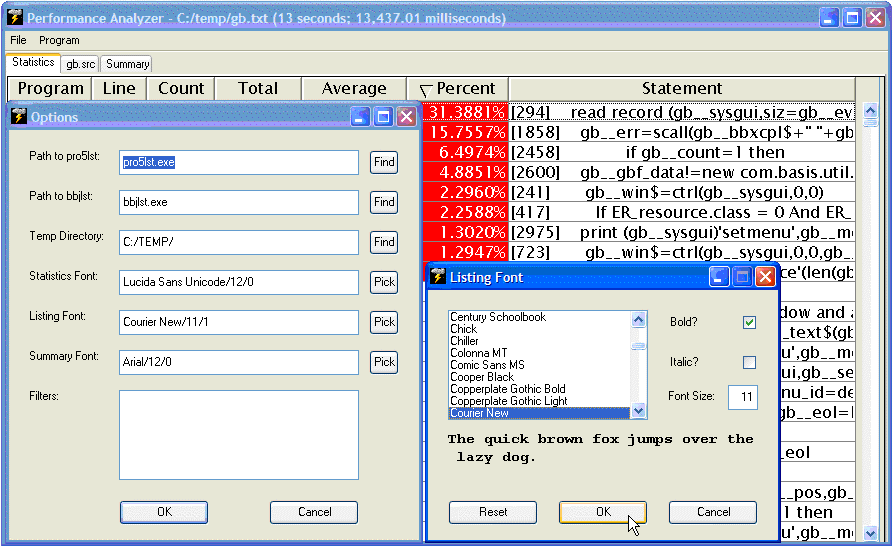
In order for this feature to work correctly, BBj must be able to locate the correct external lister program: pro5lst for BBx programs or bbjlst for BBj programs. The full paths to these external lister programs can be set by selecting Program->Options from the menu, as shown below:
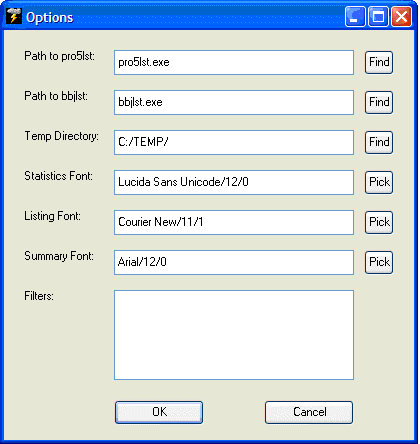
The Options dialog allows customization of the fonts for each of the grids. For example:
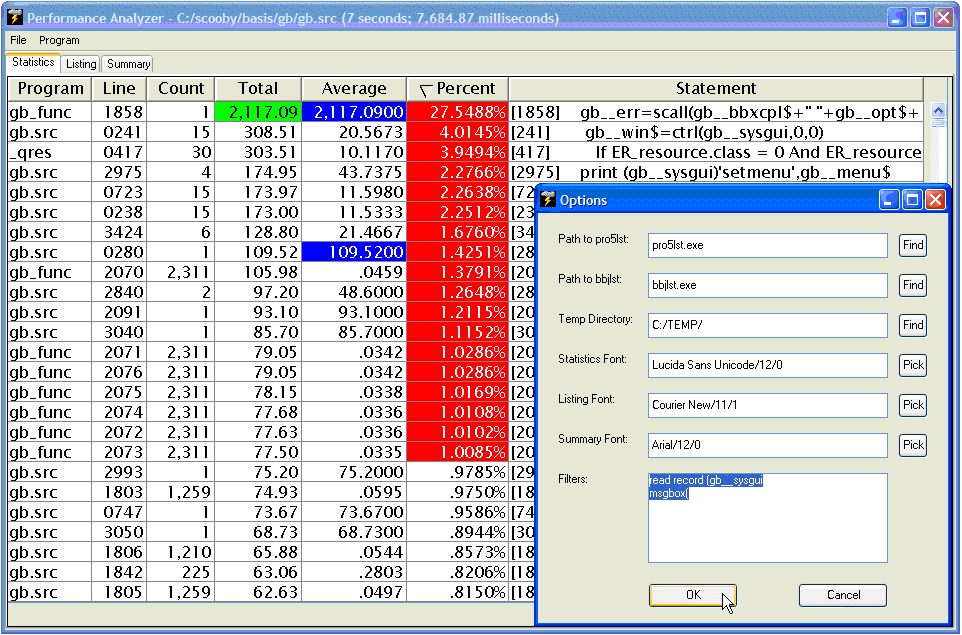
The Options dialog also allows the developer to specify filters, which indicate lines of code that should be omitted from the analysis. The example below shows the filtered out msgbox() function and reading from the SYSGUI event queue. In both cases, time measures how long the user took to respond to a prompt. When looking for performance bottlenecks in a program, it is helpful to eliminate user time, focusing only on processing time.
Summary
The Summary tab, shown below, displays one line per program to identify where time was spent on a program by program basis:
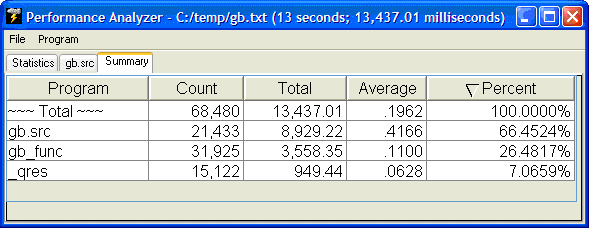
Because it can take several seconds to parse a timed settrace file, a File >Save option is available to save the processed workfile, with a .pro extension. This file can then be loaded instantly in subsequent runs of the Performance Analyzer.