_prof Utility - Performance Analyzer
Visual PRO/5 Syntax
vpro5 _prof.BBx {- tracefile}
call "_prof.BBx"{,tracefile}
run "_prof.BBx"
BBj Syntax
bbj _prof.bbj {- tracefile}
call "_prof.bbj"{,tracefile}
run "_prof.bbj"
Description
The _prof utility, which can be found in the GUIBuilder directory as of Visual PRO/5 4.00 and BBj 2.01, is an interactive GUI tool for analyzing timed settrace files. For more information, see SETTRACE Verb - Set Line Tracing.
This utility can be used to identify code that is executed a large number of times or is taking a long time to execute. For example, the screen below shows a short extract from a trace file taken from a run of GUIBuilder:
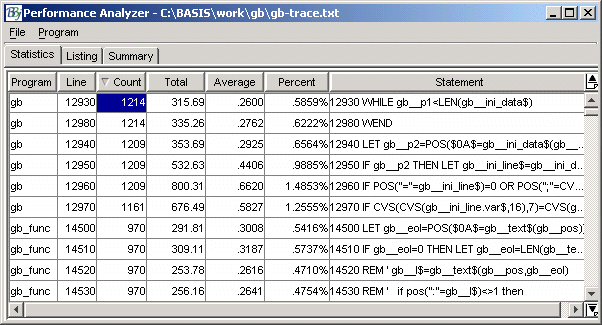
Single-clicking on a grid header enables the grid to be sorted by any of the following:
-
Program/Line number
-
Count (number of times the line of code was executed in this run)
-
Total (total number of milliseconds spent on this line through the course of the run)
-
Average (Total ÷ Count)
-
Percent (Percentage of total time spent on this line)
To toggle between ascending and descending sequence, click the grid header a second time.
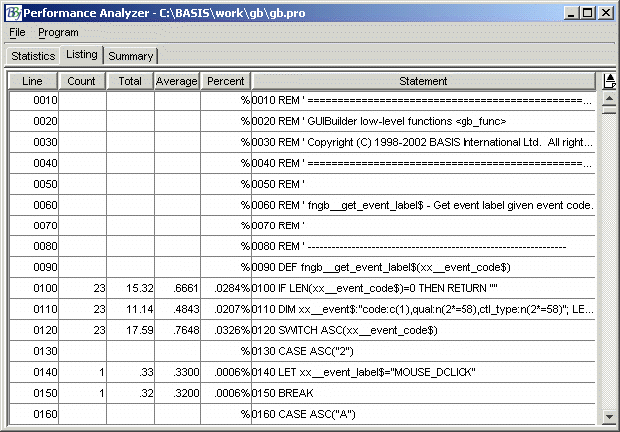
To see a complete listing for a selected program, double-click on any line in the grid. After being prompted for the location of the corresponding program and then selecting that program, a listing will be generated and the display will shift to the Listing grid (the second tab). For example:
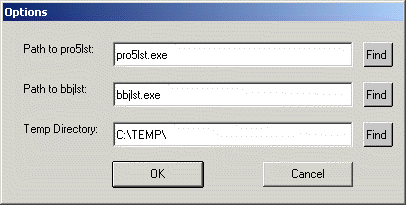
If Visual PRO/5 or BBj cannot locate the external lister utility, the above mentioned procedure will not work properly. To specify the location for the external lister, follow the steps listed below:
1. Select Program.
2. Select Options.
3. Enter the full path(s) to the lister program(s), and the temporary directory as shown in the screen below.
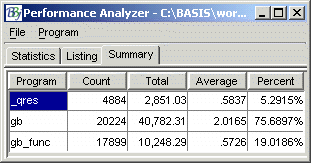
The Summary tab shown below displays one line per program to identify where time was spent on a program by program basis:
Because it can take several seconds to parse a timed settrace file, a File->Save option is available to save the processed workfile, with a .pro extension. This file can then be loaded instantly in subsequent runs of the Performance Analyzer.