
Widget Wizard
In BBj 15.0 and higher, access to full functionality of this feature requires an active Software Asset Management (SAM) subscription. See Benefits of ‘Software Asset Management” Feature Line.
Overview
In BBj 15.0 and higher, the Widget Wizard is a BASIS development tool that generates BBj Object Oriented code to create, manage, and display a Widget, Widget Set, or Widget Dashboard. This easy-to-use WYSIWYG utility allows users to specify attributes and data that in turn generates the Javadoc commented source code. You can create the widget-based code as a control or window, and run it in a browser on the desktop or on a mobile device or via a Thin Client GUI console. When you finish running it, the Widget Wizard displays the few lines of code necessary to invoke the generated code. You can easily copy and paste this code for use within your own BBj application. The Widget Wizard is a BBj program, therefore it runs on all supported BBj platforms and can be run in GUI or BUI mode.

For complete Widget Wizard documentation,click here.
Tutorial
To follow along with this tutorial, first launch the Widget Wizard.
From the
BASIS startup menu -- Select Demos to open LaunchDock and choose
Widget Wizard in the Development Tools section. 
From inside
BDT Eclipse -- Select the Widget Wizard menu item from the BBj
menu 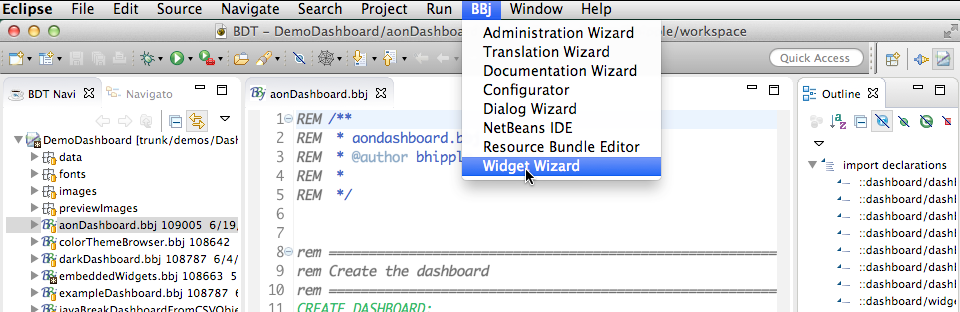
Step 1 - Select the desired build item
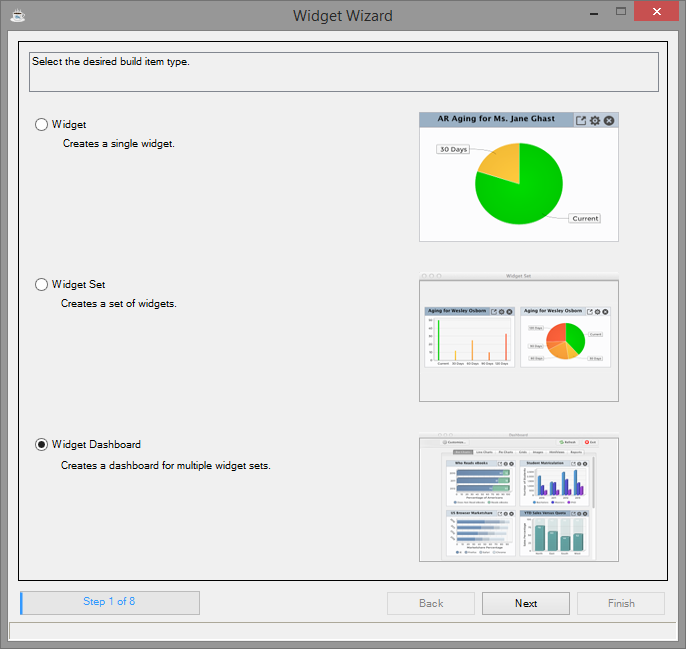
1. Choose the “Widget Dashboard” that incorporates all aspects of the Widget Wizard.
2. Select [Next].
Step 2 - Select the container for the Widget Dashboard
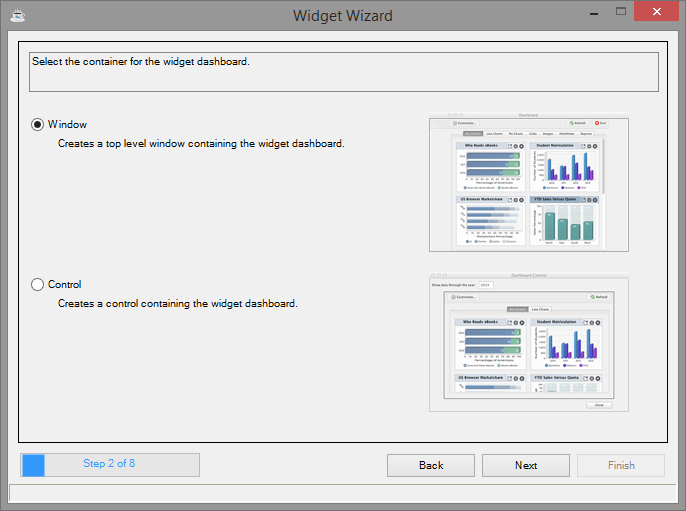
You can create widgets in their own window or as a control to incorporate into an existing window.
1. Choose “Window.”
2. Select [Next].
Step 3 - Title and name the Widget Dashboard
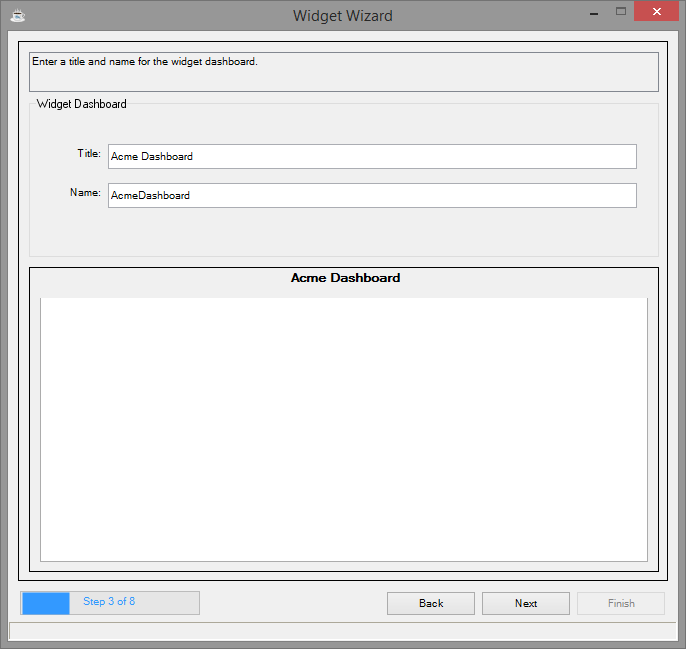
1. Enter the Title Acme Dashboard to display in the window title bar.
2. Enter the Name AcmeDashboard for the Widget Dashboard.
3. Select [Next].
Note that the Wizard automatically generated a name based on the title you entered, but you can change it.
Most of the remaining steps in the Wizard are similar; they allow you to set properties and immediately see the effect of those changes in the preview display at the bottom of the screen. In this case, notice that the title you entered appears in the title bar of the preview display.
Step 4 - Create categories for the Dashboard
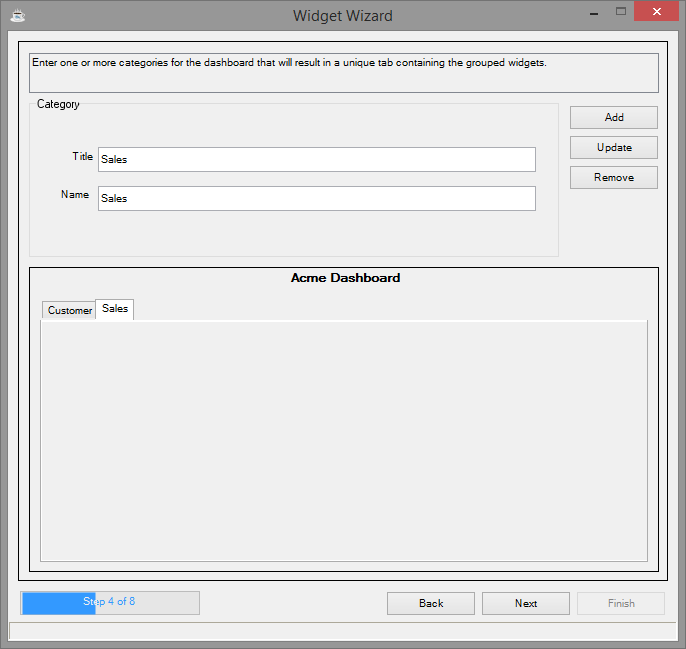
Since we elected to create a widget Dashboard, each category will create a new tab on the dashboard that can contain widgets.
Create two categories: Customer and Sales.
1. Enter Customer in the Title field (this text will automatically duplicate in the Name field when you select [Add] unless you optionally want to enter other text as the Name).
2. Select [Add].
3. Enter Sales in the Title field and select [Add].
The preview display should now show a window with Customer and Sales tabs.
4. Select [Next].
Step 5 - Define a type, title, name, and description for each widget
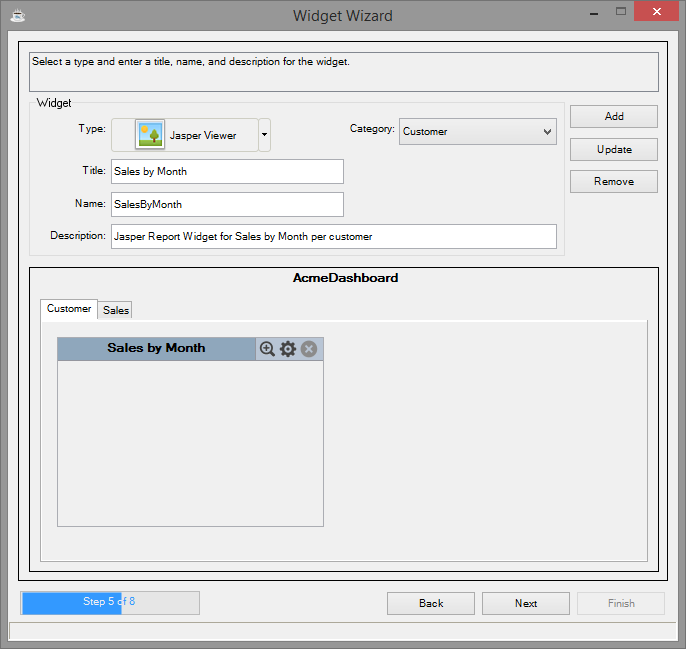
Select a type for each widget to appear in the Widget dashboard and give them a Title and Name.
Begin with the Customer Category.
Create a Sales by Month Widget
1. Select “Customer” in the Category dropdown list or select the “Customer” tab in the preview display.
2. Select “Jasper Viewer” in the Type list.
3. Enter the Title Sales by Month.
4. Enter the Description Jasper Report Widget for Sales by Month per customer.
5. Select [Add] and the Sales by Month widget now appears in the Customer tab in the preview display as shown above.
Create a Customer Information Widget
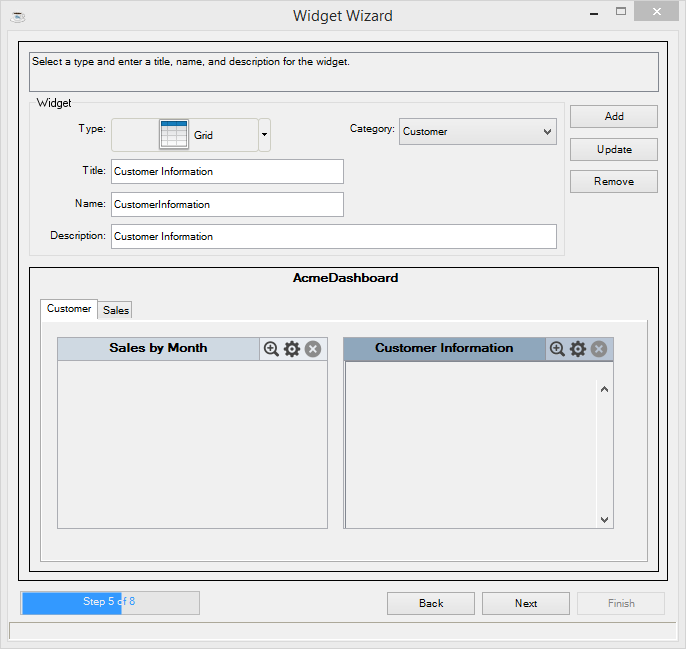
1. Select “Grid” in the Type list.
2. Enter the Title Customer Information
3. Enter the Description Top Information.
4. Select [Add] and the Customer Information widget now appears in the Customer tab in the preview display as shown above.
5. Select [Next].
Create a Sales by Salesperson Widget
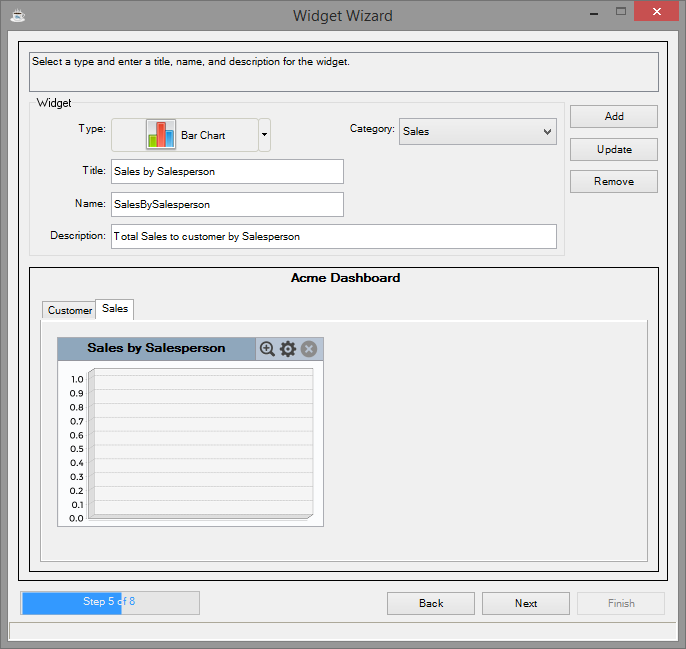
1. Select “Sales” in the Category dropdown list or select the “Sales” tab in the preview display.
2. Select “Bar Chart” in the Type list.
3. Enter the Title Sales by Salesperson.
4. Enter the Description Total Sales to customer by Salesperson.
5. Select [Add] and the Sales by Salesperson widget now appears in the Sales tab in the preview display as shown above.
Create a Customer Sales Widget
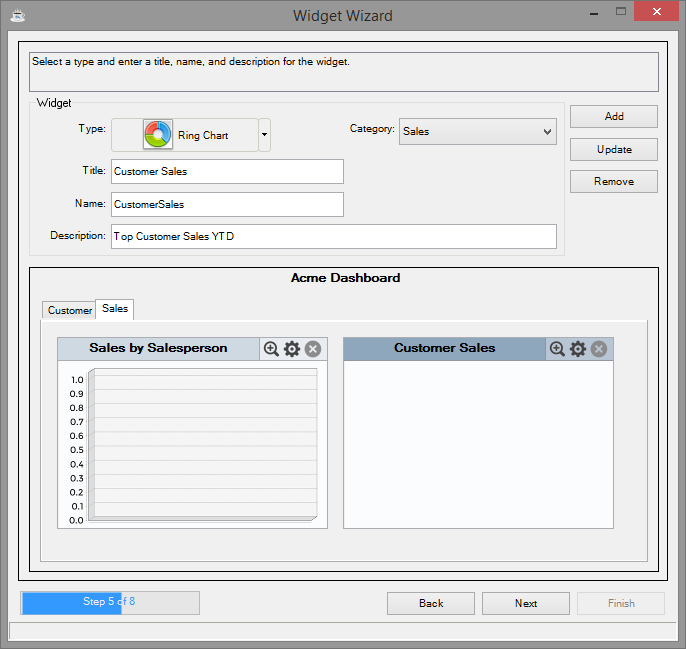
1. Select “Ring Chart” in the Type list.
2. Enter the Title Customer Sales.
3. Enter the Description Top Customer Sales YTD.
4. Select [Add] and the Customer Sales widget now appears in the Customer tab in the preview display as shown above.
5. Select [Next].
Step 6 - Select the data to fill each widget
Select the data to display in each widget in the widget dashboard.
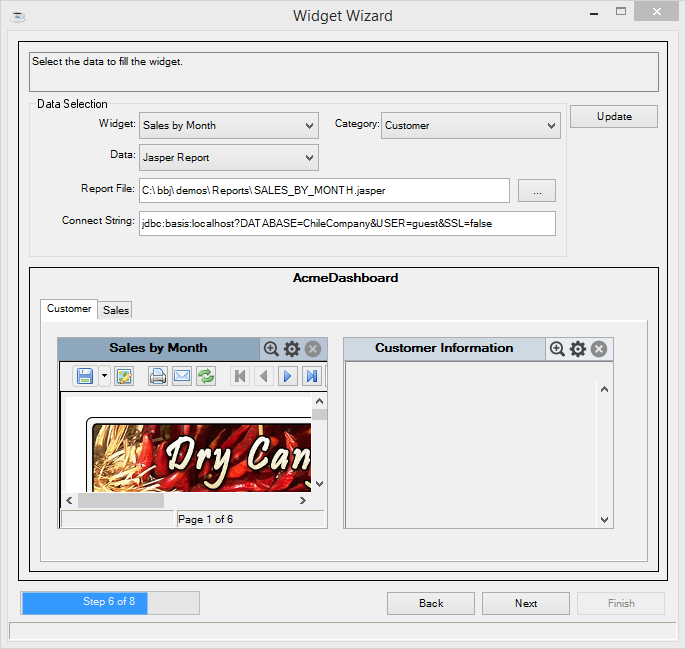
Sales by Month
Begin with the Customer Category, which is already selected in the Category dropdown list.
1. Select “Sales By Month” in the widget dropdown list.
2. Enter the Report File (replacing <bbj install dir> with your BBj installation directory):
<bbj install dir>\demos\Reports\SALES_BY_MONTH.jasper
3. Select [Update] to show the Sales By Month widget with the results of the report in the preview display.
The Connect String defaults to the ChileCompany Database and should not need editing.
Customer Information
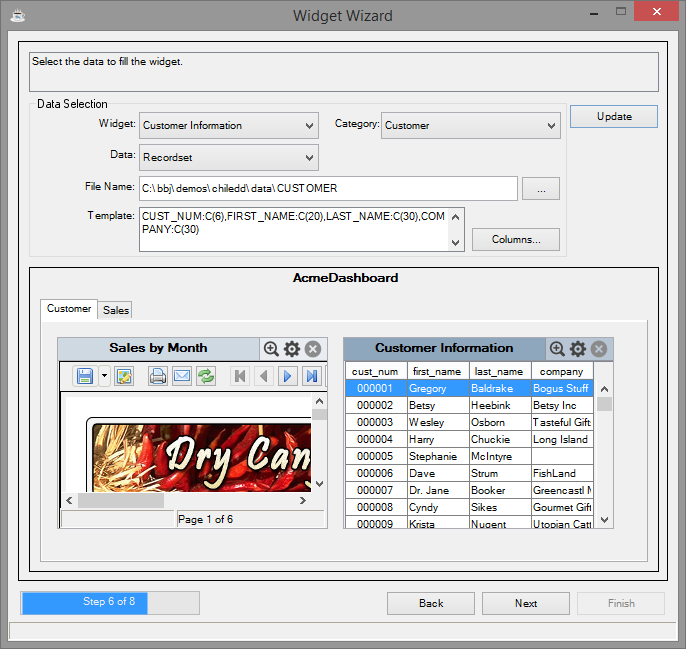
1. Select Customer Information in the Widget dropdown list.
2. Change the data type to 'Recordset" in the Data dropdown list.
3. Enter the following File Name (replacing <bbj install dir> with your BBj installation directory):
<bbj install dir>\demos\chiledd\data\CUSTOMER
4. Enter the following Template:
CUST_NUM:C(6),FIRST_NAME:C(20),LAST_NAME:C(30),COMPANY:C(30)
5. Select [Columns] and verify that four columns are returned.
6. Select [Update] to show the grid of the Customer Information widget in the preview display.
Sales by Salesperson
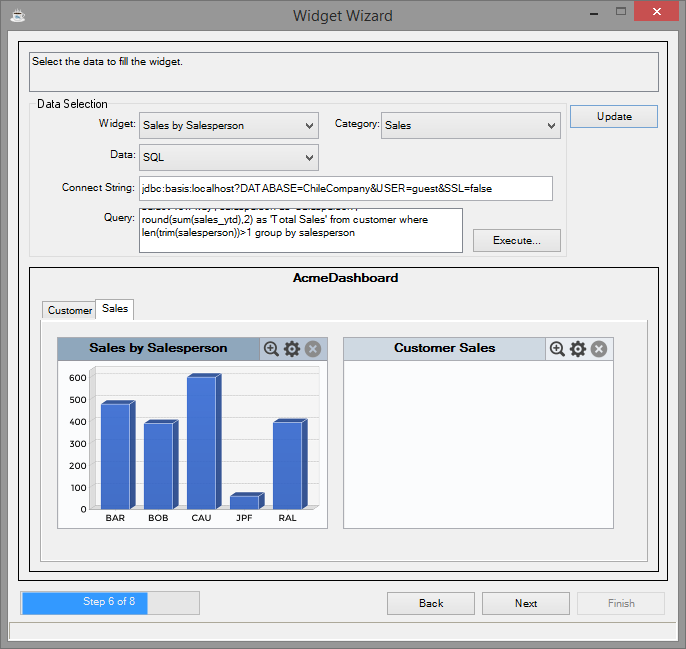
1. Change the category to “Sales.”
2. Select “Sales by Salesperson” in the widget dropdown list.
3. Enter the following query:
select 'row key', salesperson as 'Salesperson', round(sum(sales_ytd),2) as 'Total Sales' from customer where len(trim(salesperson))>1 group by salesperson
The Connect String defaults to the ChileCompany Database and should not need editing.
4. Select [Execute] and verify data is returned.
5. Select [Update] to render the bar chart of the Sales by Salesperson widget in the preview display as shown above.
Customer Sales
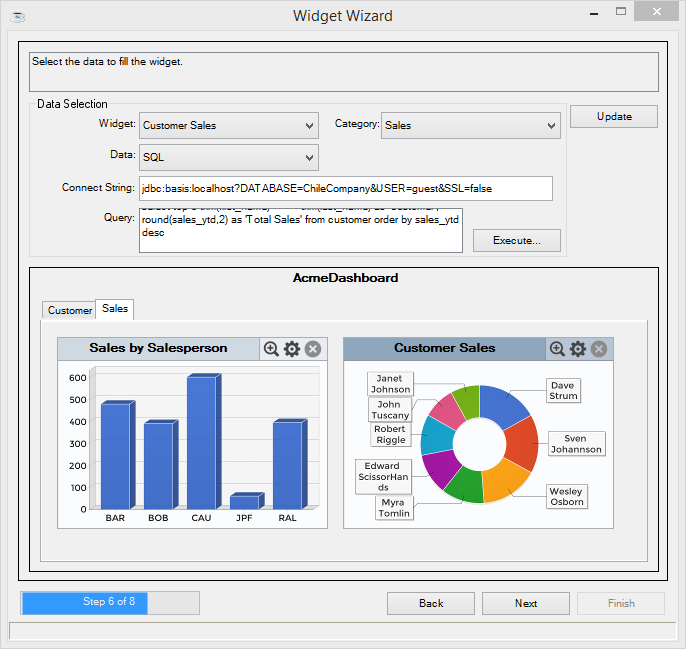
1. Select Customer Sales in the widget dropdown list.
2. Enter the following Query:
select top 8 trim(first_name) + ' ' + trim(last_name) as 'Customer', round(sales_ytd,2) as 'Total Sales' from customer order by sales_ytd desc
The Connect String defaults to the ChileCompany Database and should not need editing.
3. Select [Execute] and verify that the query returned data.
4. Select [Update] to show the Customer Sales widget with the ring chart in the preview display as shown above.
5. Select [Next].
Step 7 - Set the BBj file for the generated source code
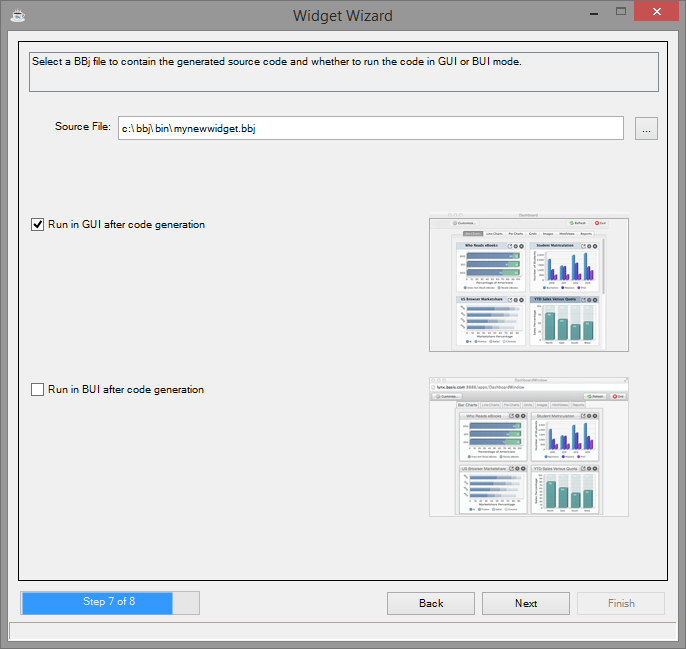
1. Enter a new Source File in which to save the Widget Dashboard code, or browse and select an existing file. Note that it will overwrite any existing file or create a new file.
2. Make sure the “Run after code generation” checkbox is marked as well as “Run in GUI after code generation.”
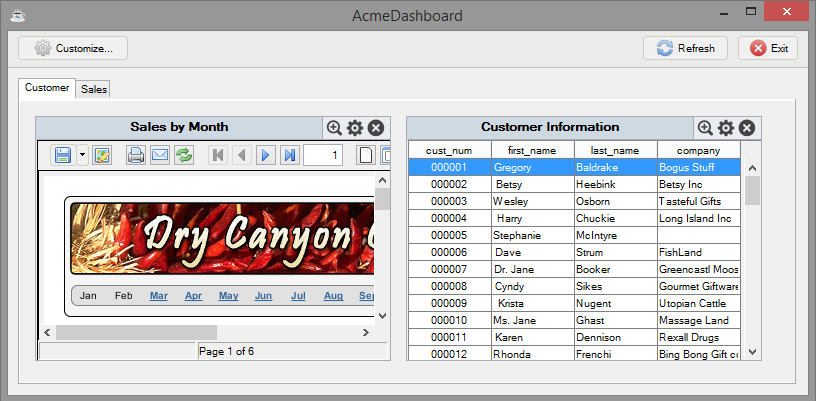
3. Select [Next] and your new Widget Dashboard is complete and displays a running sample using GUI.
Step 8 - Review the summary screen
If you chose to run as GUI, you will have to close the newly created Acme Dashboard in order for you to complete the wizard. Once you have closed it (GUI) or while the browser is displaying your Acme Dashboard (BUI), a Summary Screen appears in the Widget Wizard. This summary shows the path and name of the newly created Source File along with the code that you can copy and paste into another application to embed the widget.
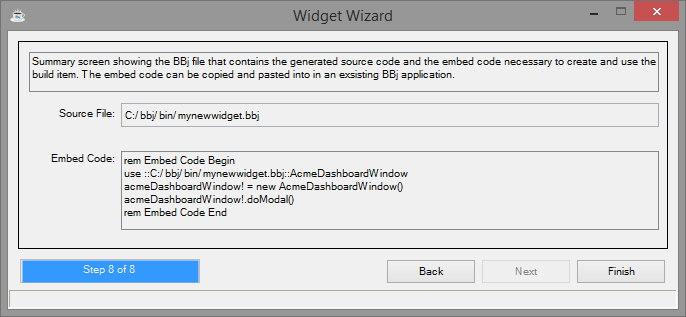
Congratulations, you just created a new Widget Dashboard in eight easy steps!