Inventory Control - ABC Analysis Report
Function
Use this task to create a report categorizing the inventory into percentage groups designated A to Z. Categories may be based on either estimated annual usage amounts in dollars or current inventory valuation in dollars. The ABC percentage values used to calculate the report are defined within the Application Parameters task, Inventory Factors option.
=> To access this task...
Select ABC Analysis Report from the Period End Processing menu.

Inventory Item ABC Report
About the Fields
From the Report Option dropdown...
-
Select New ABC Report (Y) from the dropdown list to create a new report.
-
Select Reprint Existing Report (N) from the dropdown list to reprint an existing report.
-
Press [Tab] to accept defaults as displayed.
From the Calc Total Value Using dropdown...
-
Select Qty On Hand (Q) from the dropdown list to base the report on quantity on hand.
-
Select Est Annual Usage (U) from the dropdown list to base the report on the estimated annual usage.
-
Select Curr Per Ending Bal (B) from the dropdown list to base the report on your current period ending balance.
In the Beginning/Ending Warehouse ID field...
-
Enter the code of the first/last warehouse to include on the report.
-
Press [Tab] to select the first/last warehouse code record.
-
Click
 to select from a list of warehouse codes.
Exclude Inactive Items? checkbox...
-
Mark the box (default) to exclude inactive items.
-
Unmark the box to include all items.
When done making selections...
-
Click
 to create the Inventory Item ABC Report.
 -
Click
 to clear the form and re-enter options.
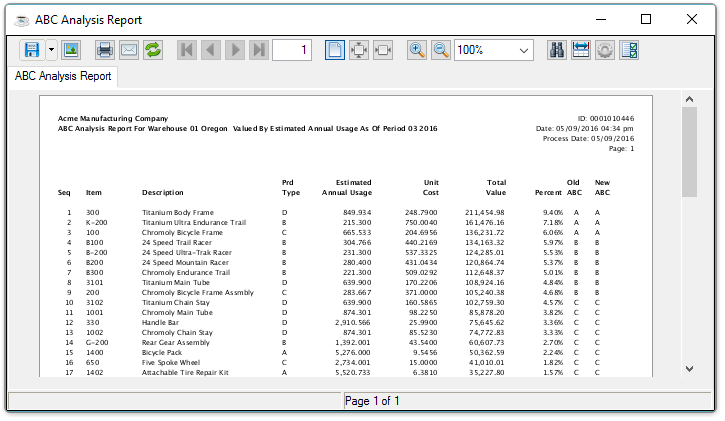
Sample ABC Analysis Report
See Output Options.
Closing the report results in the following prompt:
-
Select [Yes] to update the ABC Analysis Report.
-
Select [No] to not update the report.
Purpose of the ABC Analysis Report
The purpose of the ABC Analysis Report is to provide information about the number of items that constitute a certain percentage of inventory dollars (if selected by on hand value) or the number of items that constitute a certain percentage of inventory usage. These two different methods analyze your inventory from both an inventory valuation point of view and an inventory movement (or usage) point of view.
With the ABC Analysis Report, an inventory manager can determine which items (and the number of different items) are responsible for a certain percentage of inventory value. A production or sales manager can determine which items are used most in production or are the best “sellers.”
How the ABC Analysis Report Works
The first step in generating the report is to read through the entire inventory file and sort the items by either estimated annual usage or actual on hand value, depending on which option is selected.
If the estimated annual usage option is selected, the value for each item is the sum of the preceding year’s usage figures for all warehouses times the unit cost for the item. Actual annual usage is used if available, otherwise estimated annual usage is used.
If the on hand value option is selected, the value for each item is the on hand quantity for all warehouses times the unit cost for the item. The formula is:
On Hand Value = (On Hand Quantity) x (Unit Cost)
After the values are calculated and the items are sorted, the report is created with the highest value first and the lowest value last. The items are grouped into categories A through Z, depending on the percentages designated in the Parameter Maintenance ¾ Inventory Factors option and the total value (either usage or on hand value) of the report. Both the new ABC code assignment and the previous code assignment are shown on the report.
At the end of the report are two sets of totals, one titled “dollars” and the other titled “items.” The “dollars” figure represents the total value of the A through Z categories (respectively from top to bottom) and indicate the cumulative value of the A through Z items. The dollar total for these categories is the same as the total value of the report. The percentage figures associated with these dollar totals are also defined within the Parameter Maintenance ¾ Inventory Factors option.
The “items” figure indicates how many different items (i.e., different stock keeping units) make up the respective A through Z categories as determined by the “dollars” figure. The “% of Total” for the figure is derived as part of the report calculation. The total number of items is the same as the number of different items that appear on the report.
ABC Analysis Example
Assume you have selected the ABC Analysis by inventory on hand value, and that there are 100 different items in inventory with a combined total value of $100,000. You have factors defined for A, B, and C. The A percentage is defined as 50%, the B percentage as 30%, and the C percentage as 20%.
The report is displayed in on hand value sequence, the first set of items on the report that collectively have a value of $50,000 are designated as A items, meaning they account for 50% of the total inventory value. If there were a total of 10 items in category A, it would report that 10% of the items in inventory account for the top 50% of total inventory value by ranking. A simple analysis of these figures indicates that these 10 items make up the major portion of total inventory value.
The next group of items on the report that collectively have a value of $30,000 are designated as B items, meaning they account for the next 30% of the total inventory value, by ranking. If there were a total of 40 items in category B, it would indicate that 40% of the items to be managed would account for 30% of the value by ranking.
The last group of items on the report, which collectively have a value of $20,000 are designated as C items. There would be 50 items in inventory (i.e., 50% of the product list) that account for the remaining 20% of inventory value by ranking. This indicates that a large portion of the inventory, ordered, warehoused, financed, insured, managed, etc., accounts for a relatively small amount of the total inventory value.
How the information in an ABC Analysis Report is interpreted depends a great deal on the method selected for running the report, the type of business, the specific items in inventory, and other factors. A complete analysis is best done by the management of your particular company.
______________________________________________________________________________________
Copyright BASIS International Ltd. AddonSoftware® and Barista® Application Framework are registered trademarks.