Debugging Operations
Starting Debugger Execution
As in the BBj SysConsole, TermConsole, and WinConsole, execution of the currently loaded program is started by dot-stepping or by typing the RUN verb at the Command Console prompt. "Dot-stepping" refers to typing the decimal ('.') and then the ENTER key, which executes program lines one at a time. The edit window highlights (default blue) the next line to be executed and shows an arrow pointer in the gutter to its left.
Controlling Execution with Breakpoints
Breakpoints tell the BBj interpreter to pause execution just before the line containing the breakpoint, much like the ESCAPE verb. Once a program is loaded into the Debugger, a breakpoint is set by positioning the text caret on the desired line and performing any one of the following actions:
-
Right click in the Debugger's editor window to display the pop-up menu and select the Toggle Breakpoint menu item.
-
Press Shift+F8.
-
Left click in the gutter beside the desired line.
A red ball will appear in the gutter and the line will be highlighted in the selected breakpoint highlighting color (default red). When a program is run using the RUN verb, execution will stop when it hits a line containing a breakpoint. To remove a breakpoint, simply repeat one of the steps above, and it will toggle off. Any number of breakpoints can be set in a program.
Breakpoints can be set in either the Debugger or the Source Editor. Any active breakpoints are automatically saved to disk in a separate breakpoint file whenever the user elects to save the program source. The breakpoint file is given the same name as the source file and a .bpf extension. Breakpoint files are kept in the same directory as their corresponding source files. When a BBj program file is loaded into the Debugger or Source Editor, the system checks for the presence of a matching breakpoint file and loads any breakpoints it finds there.
A complex debugging scenario can be prepared using these steps:
-
Load each file that needs debugging into the Source Editor, including any files that are accessed via the BBj 'CALL' verb, which ought to have breakpoints.
-
Set breakpoints as necessary in the source code of these files, using the mechanisms described above.
-
Save the files from the Source Editor, which will cause the breakpoints to be saved also.
-
Compile the files into BBj token format as required. Note that if the compiled files are placed in a different directory than the text source files, the .bpf files must be manually copied to the directory where the compiled files are located.
-
Start the Debugger with the initial application program. The breakpoints applied in the Source Editor will also appear in the Debugger.
-
Type RUN at the command prompt. The interpreter will execute statements until a breakpoint is encountered, either in the initially loaded program or a CALLed program.
Correcting Syntax Errors
Lines containing syntax errors identified by the BBj interpreter are highlighted with the selected error highlight color (default green). A triangular lightning bolt symbol appears in the gutter to the left of the line containing the syntax error. Making a change to the line and moving the cursor to another line in the editor window will cause the interpreter to reevaluate the syntax of the line. If it is found to be correct, the highlighting and error symbol will be removed.
Watching Variables
Variables in the running program can be monitored in the Debugger's Watches window. "Watched" variables have their values updated as they change during program execution.
To watch a variable in the current program, or a variable that has been entered at the command prompt, type the following at the command prompt in the Command Console window:
.WATCH <variable name>
If the variable is initialized in the active program, the variable name appears in the Watches window along with its current value. If the variable is not initialized or is not in the active program, then the variable will not appear in the Watches window. To remove a watch on a variable, type:
.UNWATCH <variable name>
Viewing the Command History
The Command History window displays all the program statements that have been executed in the current debugging session, whether those commands were typed at the Command Console's command prompt by the user, or executed from the loaded program via dot-stepping from the command prompt. Runtime errors are also displayed in the Command History. Note that lines executed from the program after using the RUN verb are not displayed.
Viewing CALLed Programs
When a CALL statement is executed in the Debugger, the called program is opened in a new editor window. The level number shown on the new window's name tab is always one increment higher than the level of the calling program. The focus changes to the new editor window, where a new current line appears. Dot-stepping continues at this new level. Although focus can be changed to any open program level by clicking on the desired name tab with the mouse, only the highest open level (the one containing the current line) can be edited. When the called program is completed, control is returned to the lower-level calling program and the previous higher-level window is removed.
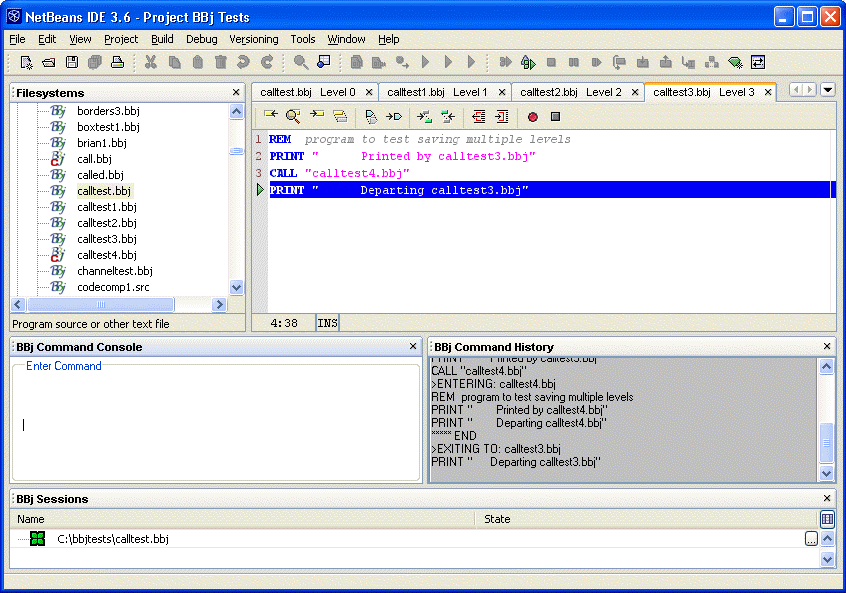
The above image shows a five level program being executed in the Debugger. The initially executed program, level 0 in the hierarchy, is named calltest.bbj. In this example, the level 0 program has called the level 1 program (calltest1.bbj, as seen in the Command History), which called the level 2 program (calltest2.bbj), which called the level 3 program (calltest3.bbj) that in turn called the level 4 program (calltest4.bbj). The level 4 program has already finished execution and relinquished control back to the level 3 program. The level 4 program edit window was closed. At this point in the debugging, the level 3 program is about to execute its last line and return control to the level 2 program.
Managing Multiple Debugging Sessions
It is possible to debug multiple programs simultaneously. Each time that a BBj program is opened in the Debugger, a new debugging session is created. Each session is connected with its own BBj interpreter and creates its own editor window(s) to display program code. All debugging sessions share the Command Console, Command History and Watches windows. The information displayed in these three windows comes from the session designated as the "current" session. There is never more than one current session at a time.
The Sessions window indicates which debugging session is the current session and provides the only means for switching between sessions. Although it is possible to grab an edit window from any open debugging session and make changes in it, the Command Console, Command History and Watches windows respond only to the designated current session. Changing focus between editor windows does not affect which session is regarded as current. Furthermore, all the windows belonging to a debugging session can be closed by left-clicking the 'X' button (found on the name tab of editor windows and in the upper-right corner of the Command Console, Command History, Watches and Sessions windows). Closing all the windows belonging to a debugging session, even the current session, does not affect which session becomes current.
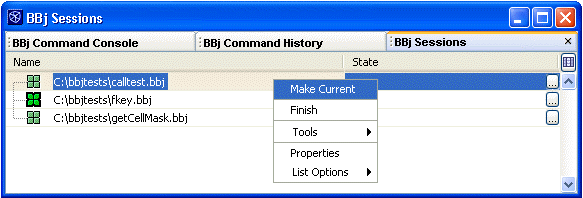
In the above image, the Sessions window shows three debugging sessions in progress. C:\bbjtests\fkey.bbj is the current session, indicated by the border style of the icon. C:\bbjtests\calltest.bbj is selected and displaying the right-click popup menu. Selecting Make Current from the popup menu would make C:\bbjtests\calltest.bbj the current debugging session.
Closing any or all of the windows belonging to a debugging session does not bring that session to an end. The session continues and the connection to a BBj interpreter remains, even though nothing is visible. Each closed window can be restored when it is needed again.
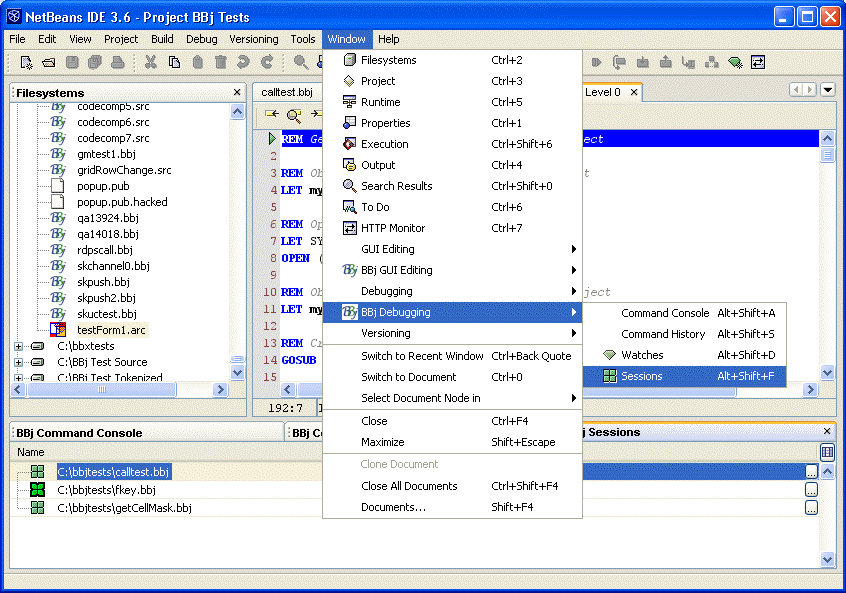
Use the Window > BBj Debugging submenu to reopen the Command Console, Command History, Watches and Sessions windows if they were previously closed. An editor window that is closed will automatically reopen when:
-
the thread of execution returns to the program which that window contains
-
a console command, such as an edit or dot-step, is directed to it from the Command Console
Closing the Debugger
As already mentioned, closing all the windows belonging to a debugging session does not end the session or close down the Debugger. The interpreter connection remains, even though no windows are visible to show the current status. To close the interpreter connection and end a debugging session, do one of the following:
-
Enter BYE or RELEASE at the Command Console prompt.
-
Right-click on the debugging session in the Sessions window and select Finish.
If multiple debugging sessions are in progress and the designated current session is closed, one of the other sessions assumes the role of the current session. Closing a single debugging session does not otherwise affect the other sessions.
The Finish BBj Debugging Sessions dialog allows selective closing of multiple debugging sessions, as shown below.
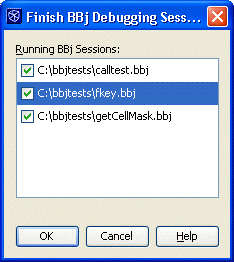
To close one or more debugging sessions with the Finish BBj Debugging Sessions dialog:
-
Select Debug > Finish BBj Sessions... from the main menu, which opens the dialog.
-
Left-click the checkbox to remove the check beside the name of each debugging session that should not be ended. (All sessions are checked by default.)
-
Press the OK button to close every checked debugging session.