BASIS IDE Debugger
Overview
The BASIS IDE Debugger is a thin client connection to a BBj server. Unlike the Source Editor, the Debugger invokes and communicates with a BBj interpreter session and requires BBjServices to be running on the server. It uses the interpreter to execute statements in the program being debugged. The Debugger is able to report syntax errors, execute program statements, monitor "watched" variables, accept console input in the form of BBj commands and do other things not possible in the Source Editor. The Debugger uses color syntax highlighting and allows editing of the loaded program's source code with BBj Object syntax code completion, just like the Source Editor.
Although PROGRESSION/4 and PRO/5 tokenized programs may be loaded in the Debugger, it is not possible to debug or execute them with PROGRESSION/4 or PRO/5 interpreters. The Debugger connects only with a BBj interpreter, and all programs in the Debugger are treated as BBj code.
The image below shows the file fkey.bbj being executed in a debugging session along with two other files being debugged at the same time. Line 110, highlighted in blue, is the "current" line, or the next line that will be executed. A breakpoint has been set on lines 170. Line 180 is marked as a syntax error, since the keyword PRINT is misspelled.
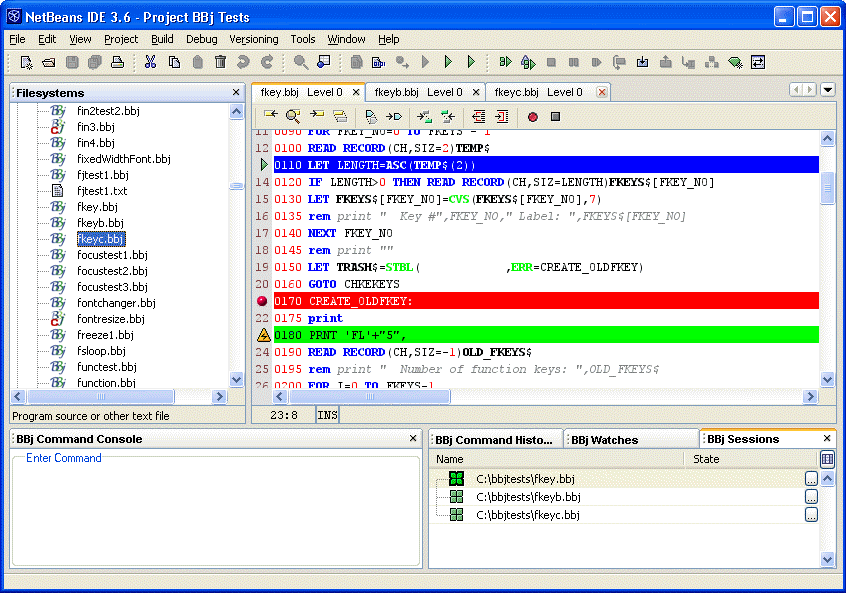
The Debugger has five separate windows for displaying information.
-
The editor for viewing and editing the program being debugged
-
The Command Console for sending commands to the interpreter
-
The Command History for viewing a history of executed commands
-
The Watch for monitoring the values of specific variables
-
The Session Manager for managing multiple debugging sessions
These windows may be positioned, closed, or restored in any combination without affecting the progress of the debugging session. The Command Console, Command History, and Watch windows are always associated with a specific editor window and debugging session, called the current session. The Session Manager window controls which debugging session is current when more than one program is being debugged at the same time.