Using Browser Developer Tools with DWC
Overview
Browser developer tools provide features for inspecting and testing DWC applications. This page explains how to open the tools, review the Elements, Console, Application, and Styles sections, inspect CSS rules and layouts, and temporarily modify an application’s text and styles. It also demonstrates applying CSS styles to BBj controls and using DWC CSS custom properties.
Opening Browser Developer Tools
Run DWC1.bbj in DWC using a system browser. Browser developer tools can be opened in several ways.:
-
Context menu: Right-click the page or a control and select Inspect. In Safari, select Inspect Element.
-
Browser menu: Open the browser menu and select the option for developer tools. The exact menu path varies by browser.
-
Keyboard shortcut: On Windows and Linux, press Ctrl+Shift+I. On macOS, press Command+Option+I. In Chrome, Edge, and Firefox, F12 can also open the developer tools.
Using Inspect from the context menu opens the developer tools with the selected page element highlighted in the Elements or Inspector panel, which is useful when examining a specific DWC control.
Configuring Developer Tools
Browser developer tools can be docked to the left, right, or bottom of the browser window, or opened in a separate window. Choose a location that provides enough space to inspect the DWC application and the developer tools at the same time.
For example, when the browser window is narrow, opening the developer tools in a separate window can provide more space for inspecting elements, styles, and other debugging information.
Most browser developer tools also provide settings for appearance and other preferences, such as selecting a light or dark theme. Available configuration options vary by browser.
Common Developer Tools Sections
-
Elements / Inspector: Displays the page's DOM and HTML structure. Use this section to select and inspect the elements that make up a DWC application.
-
Console: Displays messages, warnings, and errors and provides an interactive environment for running JavaScript.
-
Application / Storage: Provides information about browser-managed application data, including cookies, local storage, session storage, cache data, and related resources. The available information varies by browser.
-
Styles / Rules: Displays CSS rules that apply to the currently selected element and allows the rules and property values to be inspected or temporarily modified.
-
Computed: Displays the final CSS property values that the browser applies to the selected element after evaluating applicable CSS rules.
Inspecting and Testing DWC Elements and Styles
With DWC1.bbj running in DWC, use the browser's Elements or Inspector tool to select the element associated with the application's title.
The most direct method is to use the element selection tool and then select the title text in the running DWC application. The corresponding DOM element is highlighted in the developer tools.
After selecting the title element, edit its text directly in the DOM tree. For example, change Hello BBj DWC to another value. The browser immediately displays the updated text.
You can also use the Styles or Rules section to temporarily test CSS changes on the selected element. For example, add:
color: green;
The browser immediately changes the title text to green:

Changes made directly in the browser's developer tools are temporary and are removed when the page is refreshed or the DWC application is launched again. Use these temporary changes to test text, CSS properties, and values before making permanent changes in the BBj program or an external stylesheet.
Toggling Styles and Testing DWC CSS Custom Properties
After selecting the application's title element in the browser's Elements or Inspector tool, use the Styles or Rules section to test changes to the applied CSS.
You can temporarily disable an individual CSS declaration by using the toggle control next to the property. For example, disable the text-align declaration to see how the title bar text is affected.
You can also test DWC CSS custom properties by changing the temporary color value added in the previous step. Replace:
color: green;
with a DWC CSS custom property, such as:
color: var(--dwc-color-danger);
The following screenshot shows the Styles section while editing the title element’s color and viewing available CSS value suggestions after typing var(.
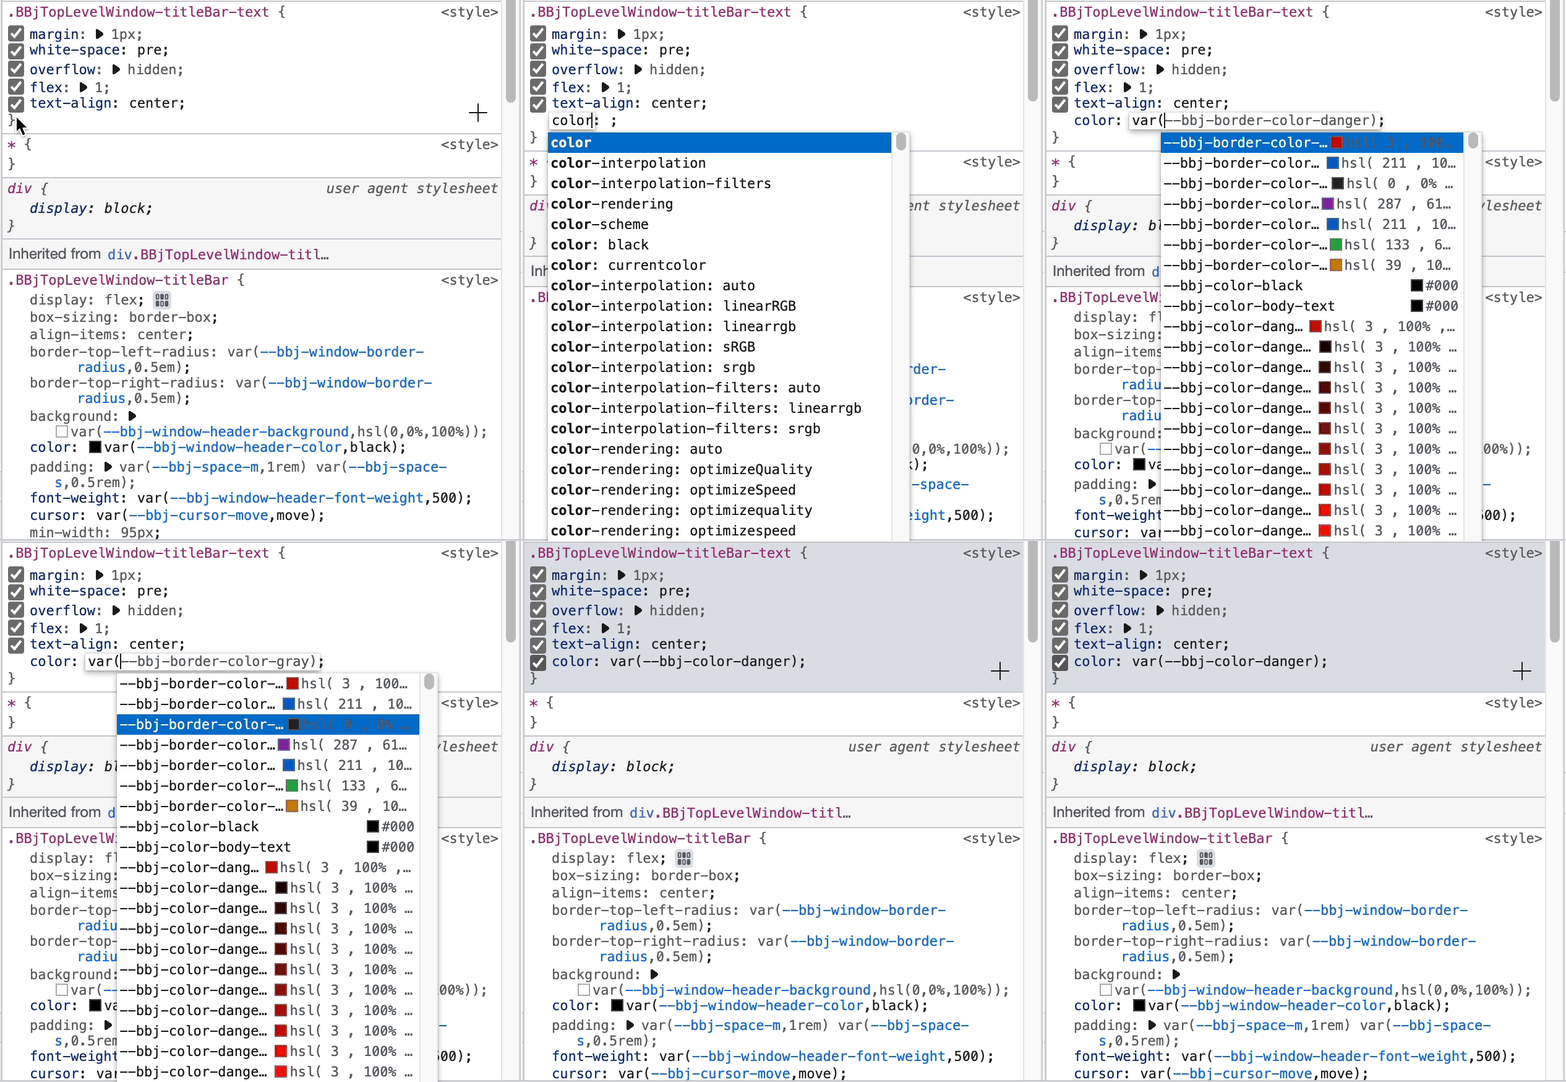
When you begin typing var(, the browser may display CSS value suggestions, including available DWC color variables. This makes it easier to test DWC theme values directly in the browser before deciding which value to use in the application.
These style changes are temporary and are intended for testing. After confirming the desired result, apply the final styling in the BBj program or in an external stylesheet.
Applying CSS Styles to BBj Controls
After testing CSS changes in the browser's developer tools, use the BBjControl::setStyle() method to apply CSS properties from BBj code.
In the sample application, st! references a BBjStaticText control. In DWC, the rendered static-text control can be inspected in the browser as a dwc-static-text element. The following code sets the control's text color to green:
st!.setStyle("color","green")
Run the application in DWC to view the updated text color.
Instead of using a hard-coded color value, you can use a DWC CSS custom property. For example:
st!.setStyle("color","var(--dwc-color-info)")
Using the CSS custom property applies the current DWC info theme color rather than a fixed color value.
Inspecting CSS and Layout in Developer Tools
Browser developer tools can be used to inspect the CSS rules and layout information applied to DWC elements. After selecting an element in the Elements or Inspector tool, use the Styles, Rules, and Computed sections to review the CSS that affects the element and identify which property values are currently applied.
Developer tools can also visualize CSS layouts, including grid structure, spacing, and element dimensions. These features are useful for understanding how CSS rules affect the appearance and positioning of controls in a DWC application.
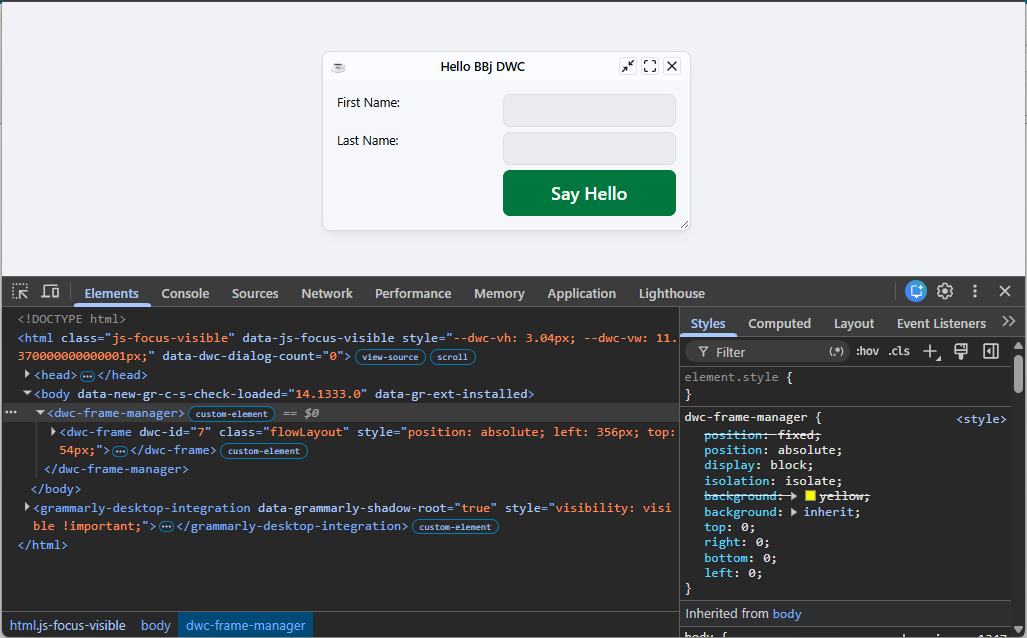
The following screenshot shows the DWC1.bbj application running in DWC with the browser's Developer Tools displayed. The Elements panel and the Styles and Computed sections provide access to the DOM structure, CSS rules, and calculated style values for the selected DWC element.
Reviewing Applied Styles and Style Precedence
When you select a DWC element in the browser’s Elements or Inspector tool, the Styles or Rules section displays the CSS declarations that apply to that element.
The element.style section represents inline styles applied directly to the selected element. Other sections show matching CSS rules from stylesheets or shared selectors.
You can use this view to add new declarations, modify existing values, or temporarily disable individual properties while testing.
When multiple declarations set the same property, the browser’s CSS cascade and CSS specificity help determine which value is applied. For normal author styles, an inline style generally takes precedence over matching stylesheet rules. Declarations that are overridden are shown crossed out in the developer tools, which helps identify which value is currently affecting the selected element.
Inspecting CSS Grid Layouts
When the DWC1.bbj application uses CSS Grid for the window layout, the browser’s Developer Tools can be used to inspect the resulting grid. Select the window content in the Elements panel to view its layout information.
In the DWC output shown here, the grid container is represented by a dwc-window-content element. When an element has display: grid or display: inline-grid, Chrome displays a grid badge next to the element in the Elements panel. Select the grid badge to toggle the grid overlay on the running application.
In the sample application, the CSS Grid layout is applied to the window content with BBjWindow::setPanelStyle(). This method sets CSS properties on the content panel of a BBjWindow.
The following screenshot shows the selected DWC window content with the CSS Grid overlay enabled in the browser’s Developer Tools.
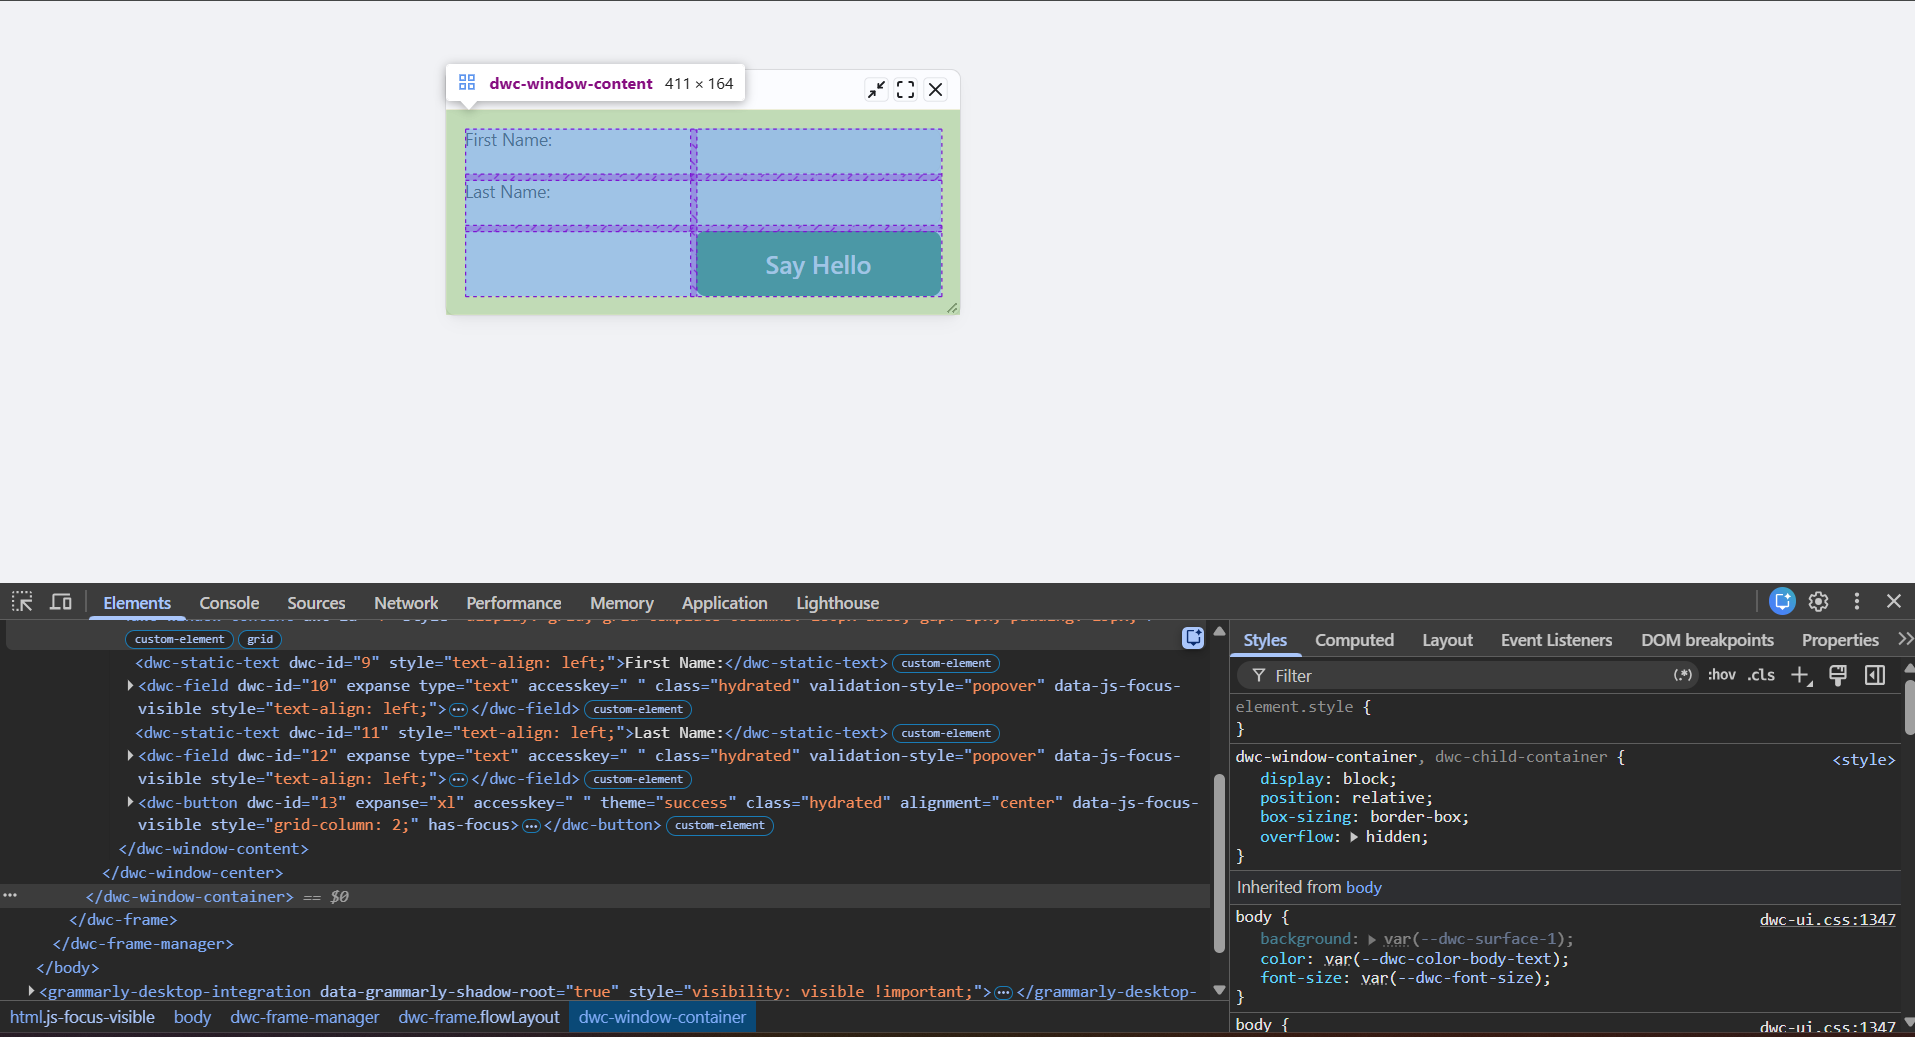
The overlay displays the grid structure used to position the controls. Chrome’s Layout pane provides additional grid inspection options, including displaying grid line information, track sizes, and grid overlays.
See Also
Dynamic Web Client (DWC) Overview