Dashboard Chart Customization
Color Customization
Modifying the colors in a chart is one of the most common customizations. It is very common to have multiple charts in a dashboard, all using different color schemes to stand out from one another. Color themes are typically used to bring meaning to the data. By way of example, a chart that tracks expenses will commonly use shades of red, whereas a chart tracking income will often use shades of green. Choosing the right colors for you dashboard charts is important, as colors typically evoke emotions and affect the legibility of the data. Some colors are soothing and restful, such as lighter pastels, whereas others are active and demand attention, such as highly-saturated unnatural colors.
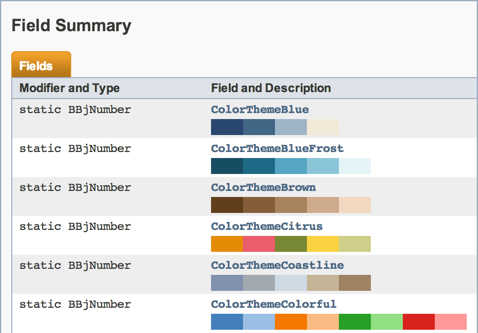
The Dashboard utility offers you complete control over the colors for a Chart. You can specify the background of the entire chart, or just plot, with a color, image, or pattern. You can also specify the colors used to render the data, so you can have blue bar charts, line charts with red and green lines, etc. When creating colors for the data, you can specify the colors in several different formats, and can define the colors hue, saturation, brightness, and opacity - everything you need to completely define your desired color. The ChartWidget offers several color helper methods to create and manipulate color themes. It also offers over fifty built-in color themes that are easy to use and are listed in the documentation, a small sampling of which is shown below:
Choosing the Right Color Theme For Your Chart
When selecting a color theme for your chart, you will want to consider whether the colors should be sequential, divergent, or categorical. Some color themes work better than others depending on the type of chart and the data it displays. This means that you should take the data into account when choosing a color theme. Below are three examples of color themes and when to use them.
● Sequential
- used when ordering values from low to high or vice versa![]()
● Divergent
- used when the values are ordered and there is a noteworthy midpoint![]()
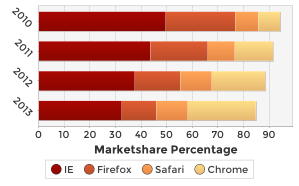
● Categorical
- used when data falls into distinct groups, such as year, and therefore
should contrast with their adjacent colors![]()
Using the ChartWidget’s Built-in Color Themes
The ChartWidget class offers a getColorTheme() static method along with dozens of static field definitions to return a BBjVector filled with Java Color objects. You can use the resultant vector to set the colors for your chart’s data. Here is a simple example:
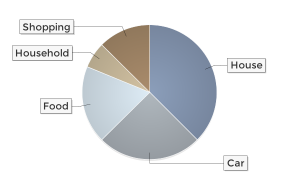
colors! = ChartWidget.getColorTheme(ChartWidget.getColorThemeCoastline())
myPieChart!.setChartColors(colors!)
The Coastline color theme is defined and viewable in the documentation as:
![]()
So the resultant pie chart uses those colors for the slices and looks like this:
Creating Your Own Color Themes
You can easily create your own color themes based off of your favorite colors, your corporate colors, or any other source of inspiration. Various web sites offer online color palette tools that make it easy to create your own palettes, browse user-submitted palettes, and even modify popular palettes to suit your taste. Adobe’s Kuler is an example of one such site. They even offer a Kuler iPhone app that allows you to create color palettes to save and share via your smartphone. Simply aim the camera and the app reacts in real-time, building live color palettes from what is in the camera’s view. It can also build palettes from images in your photo stream or Flickr account. Once you’ve found a color palette you like, simply copy the hex values, build a color vector, then set your chart’s colors to the newly created vector. Here is a step-by-step example using a Kuler color theme.
1. Load
the Sundried Tomato and Olive Kuler
color theme in your web browser. The link goes to the color theme and
specifies the edit mode for the theme. You can use the theme as-is, or
move the circles around on the color wheel to modify it. You can also
edit each color in the palette individually using sliders to adjust the
hue, saturation, and brightness. By default, the color theme we’ve chosen
looks like this: ![]()
2. Make note of the HEX color string definition for each of the five colors
3. Copy the HEX color strings and use them to create a BBjVector of Java Colors
colors!= ChartWidget.makeColorVectorFromCommaDelimitedHexColorString("#990700,#CC542E,#FF964F,#FFCB7C,#787730")
4. Set your chart’s colors using the newly-created colors! vector
myChart!.setChartColors(colors!)
5. Enjoy your customized chart! Note that the chart below only has four distinct rowKeys, so only the first four colors in the palette were used.
Using the ChartWidget’s Color Helper Methods
You can easily generate your own BBjVector of Java Colors for a chart using the ChartWidget’s getVectorOfJavaColorsFromHexColorStrings() method. It is a static method, so you do not have to create an object - just execute the method off of the ChartWidget class and provide the input parameters which include the number of desired colors to generate, the starting and ending colors, and the starting and ending opacity values. The method will create a BBjVector and fill it with the desired number of Java Color objects. The first color is built from the starting color parameters you provided, and the last color is built from the ending color parameters. All of the colors in between those two colors are dynamically generated by modifying the hue, saturation, and brightness values on a continuum that begins with the starting color and ends with the finishing color. Here’s an example that creates a vector of Colors using this method. It specifies that the resultant vector should contain five colors, starting with a fully opaque dark blue and ending with a fully opaque light blue
colors! = ChartWidget.getVectorOfJavaColorsFromHexColorStrings(5, "#436684", "#cfdae2", 1, 1)
This generates the following color palette:
![]()
We can execute the method again, this time specifying ten colors, which results in a color palette that starts and ends with the same colors, but this time it contains ten different colors:
![]()
Many charts offer a getNumRows() method can be used as input to the above method, thus allowing you to generate the exact number of colors needed for the rows in the chart.
The ChartWidget also offers methods to adjust the brightness, opacity, and saturation of every Color in a BBjVector. Here is an example that starts out with the same palette of five blue colors, but then increases the saturation of all of the colors by 25% and then increases their brightness by 25%:
colors!= ChartWidget.getVectorOfJavaColorsFromHexColorStrings(5, "#436684", "#cfdae2", 1, 1)
colors! =ChartWidget.adjustColorVectorSaturation(colors!, .25)
colors! =ChartWidget.adjustColorVectorBrightness(colors!, .25)
This results in the following palette, which is decidedly different from the original palette shown above:

These same kinds of modifications may be done on the built-in color themes as well, so it’s possible to take an existing color theme, such as Colorful2:
![]()
and adjust the brightness and opacity to soften the color palette:

In addition to creating vectors full of colors and modifying all of the colors in the vector, the ChartWidget offers several other color modification methods. You can modify an individual Color’s saturation, brightness, and opacity. You can also get a Java Color with opacity from a BBjColor or a hex string description, like the color specification commonly used in HTML and CSS.
In some cases, a color theme will not have enough color entries for every element in the chart. The ChartWidget handles that problem easily via methods that extend a built-in or custom color theme by adding duplicate entries that have been successively lightened, darkened, or made less opaque. As an example, we can take the Sundried Tomato and Olive theme from above:
colors!= ChartWidget.makeColorVectorFromCommaDelimitedHexColorString("#990700,#CC542E,#FF964F,#FFCB7C,#787730")
![]()
We can then extend it from five colors to ten colors by adding lighter versions of each of the original five colors or darker versions of the colors:
colors!= ChartWidget.makeLargerColorVectorByLightening(colors!,10)
![]()
colors!= ChartWidget.makeLargerColorVectorByDarkening(colors!,10)
![]()
We now have a vector that we can use with ten different data sets, instead of just five. All of the colors are unique, and the newly-added colors are based off the original colors in the palette so they still fit in the color theme.
It’s easy to create divergent color themes as well. Simply call the getVectorOfJavaColorsFromDivergentHexColorStrings() method and supply the number of colors desired in the palette along with the starting, middle, and ending colors and opacities. Here are a few examples that build different types of divergent color palettes:
REM Two different colors on either end with light gray in the middle
colors!= ChartWidget.getVectorOfJavaColorsFromDivergentHexColorStrings(9,"#648eb4","#eeeeee","#b23434",1,1,1)
![]()
REM The same color on both ends with a different color in the middle
colors!= ChartWidget.getVectorOfJavaColorsFromDivergentHexColorStrings(9,"#b23434","#ffcc00","#b23434",1,1,1)
![]()
REM Different colors for the start, middle, and finish colors
colors!= ChartWidget.getVectorOfJavaColorsFromDivergentHexColorStrings(9,"#5177a9","#f7f7c5","#b94c46",1,1,1)
![]()
Finally, if you found a color theme that you like, but the order isn’t quite the way you would like it to be, you can use helper methods on the ChartWidget to reverse the order of the colors in the palette, rotate them forwards or backwards by a specified amount, or even shuffle the Colors into a random order.
Setting the Colors for the Chart’s Range
Instead of providing a unique color for each bar in a chart, it is possible to set a vertical gradient for the all of the bars. This is useful for the cases where the all of the bars are related to one another and you want to emphasize values above or below a particular point. By way of example, we can create a bar chart that displays the Ultraviolet index for the day. The domain axis will be the hours of the day, and the range axis will be the corresponding UV index value for that hour. The UV Index is a linear scale, with higher values representing a greater risk level of sunburn, so we can indicate the increasing risk by setting the chart’s range colors to a custom color gradient using this line of code:
myChart!.setChartRangeColors("#289500,#f7e400,#f85900,#d8001d,#6b49c8")
Whenever you define a custom gradient for the chart’s range, it will automatically supersede any other custom color settings and will apply the gradient to all of the bars on the chart. The chart is then rendered like this:
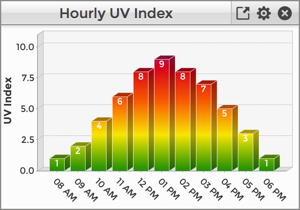
Setting the chart’s range colors, along with the height of the bars, does a great job conveying the higher level of UV radiation during the middle of the day.
Setting Dynamic Colors
As mentioned in the previous section, depending on the amount of data in the chart a color theme will may have enough color entries for every chart element. In addition to extending color themes, this problem may also be addressed using dynamic colors. The ChartWidget class offers a setChartColors() method that takes starting and ending colors as well as starting and ending opacity values. When you set your chart’s colors via this method, the dashboard will dynamically increase or decrease the amount of required colors to match the number of underlying data entries. Thechart will always have the right number of colors and each chart element will be displayed with a color in the specified range. An example of using this method looks like this:
myChart!.setChartColors("#6888ae","#7ab89c",.85,.85)
More Customizations
The chart widgets offer many other forms of customization so that you have greater control over the final presentation. Many charts offer similar customizations, but sometimes the customization is specific to the chart type. For example, it is possible to adjust the gradient shading of pie and bar charts via the setGradientShadingAmount() method. By manipulating this value you can eliminate or increase the amount of gradient shading for charts. However, only the pie chart offers the setExplodePercent() method, which allows you to specify that a particular slice of the pie should be exploded, or separated, from the rest of the pie.
By way of example, the documentation for the PieChartWidget lists all of the methods specific to the pie chart in the Method Summary section. Some of these methods allow you to set the label format, plot padding, slice outline color, and more. The documentation also details all of the methods available to a pie chart that it inherited from the ChartWidget class. These methods include ways to set the chart’s colors, background color, plot background color, legend position, and more, and are available to all chart types.
Adjusting the Chart’s Font Size
One of the more important customizations deals with the chart’s font size. Although it is possible to specify long titles and labels for the chart, doing so can decrease the legibility of the chart and may cause the longer text to be truncated. To control the sizing of the text for the entire chart, the ChartWidget class offers a setFontScalingFactor() method that allows you to scale the chart’s fonts up or down by a specified amount. If the chart’s labels appear to be truncated, in which case they will display as ellipses (...), then you could either shorten them or reduce the font size via code similar to:
myChart!.setFontScalingFactor(0.75)
The above line of code scales all of the fonts down to 75% of the original size, giving the labels and titles more room for content. The screenshot below shows the same chart with the fonts scaled 135% (left), normal or 100% (middle), and 75% (right).
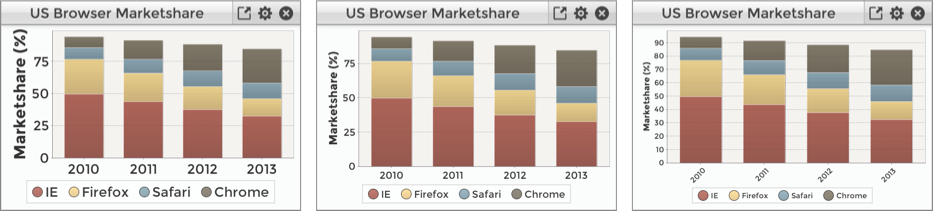
Another way to accommodate larger labels is to rotate them via thesetDomainLabelAngle() method. This allows you to rotate the label in 45 degree increments. The right most chart in the screenshot above rotates the labels up by 45 degrees, thus reducing the amount of horizontal space required to display the values.