Sales Analysis - Graphic Sales Report By Salesperson
Function
The Graphic Sales Report By Salesperson task is a graphical representation of sales by specified date range for each salesperson.
=> To access this task...
Select Graphic Sales Report by Salesperson from the main menu.

Graphic Sales Report by Salesperson
About the Fields
In the Starting Date field...
-
Enter the beginning date range to chart.
In the Ending Date field...
-
Enter the ending date range to chart.
When done making selections...
-
Select the type of chart to display by clicking the icon to the right of the Ending Date field

-
Pie
-
Line
-
Bar
-
Dial
-
Gauge
-
Area
-
Adjust the slider bar below the Starting Date to zoom the size of graphic display in/out.
Options
-
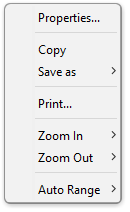
Right clicking on the graphical chart present additional charting and output options.
______________________________________________________________________________________
Copyright BASIS International Ltd. AddonSoftware® and Barista® Application Framework are registered trademarks.